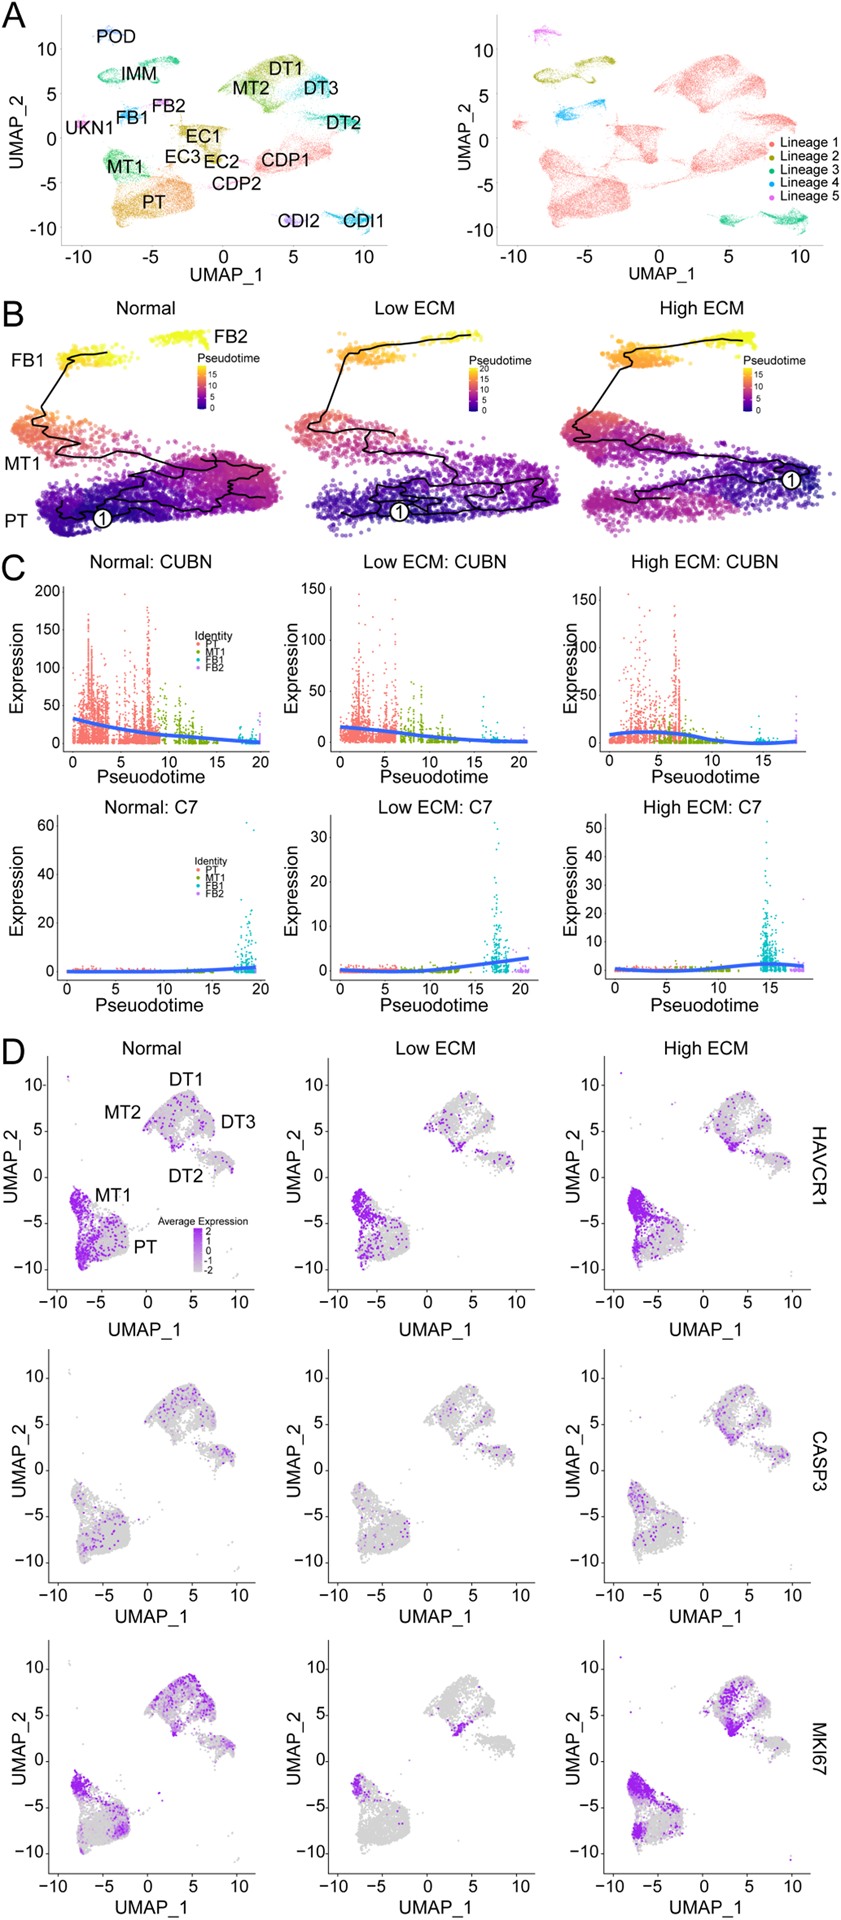
Fig. 3. Pseudotime and trajectory analysis of gene expression displaying dynamic changes in proximal tubular cells and mixed tubular cell clusters.

(A) UMAP of combined classes with 18 cell clusters (right) giving rise to a total of five unsupervised partitions (right). CDI1, collecting duct intercalated 1; CDI2, collecting duct intercalated 2; CDP1, collecting duct principal 1; CDP2, collecting duct principal 2; DT1, distal tubular 1; DT2, distal tubular 2; DT3, distal tubular 3; EC1, endothelial 1; EC2, endothelial 2; EC3, endothelial 3; FB1, fibroblast 1; FB2; fibroblast 2; IMM, immune; MT1, mixed tubular 1; MT2, mixed tubular 2; POD, podocyte; PT, proximal tubular cells; and UNKN1, unknown 1. (B) The single-cell trajectory reconstructed by Monocle 2 displaying normal (left), low ECM (middle), and high ECM (right). Each point represents a cell state at a specific time. Cells start at the root, marked by encircled one, and progress to one of three alternative reprogramming outcomes, denoted by PT, MT, FB1, and FB2. Cells must pass through the intermediate cluster MT1. Trajectory curve is highlighted by a solid black line. (C) Expression dynamics of CUBN (top) and C7 (bottom) along pseudotime that supports functional transition from PT to MT1 to FB1 and FB2 cell clusters. Cells are colored by their cluster. Orange, PT; green, MT1; blue, FB1; and purple, FB2. Solid blue line denotes average expression along pseudotime. (D) UMAP of epithelial cells with quantification of HAVCR1, CASP3, and MKI67 expression across each classification.
