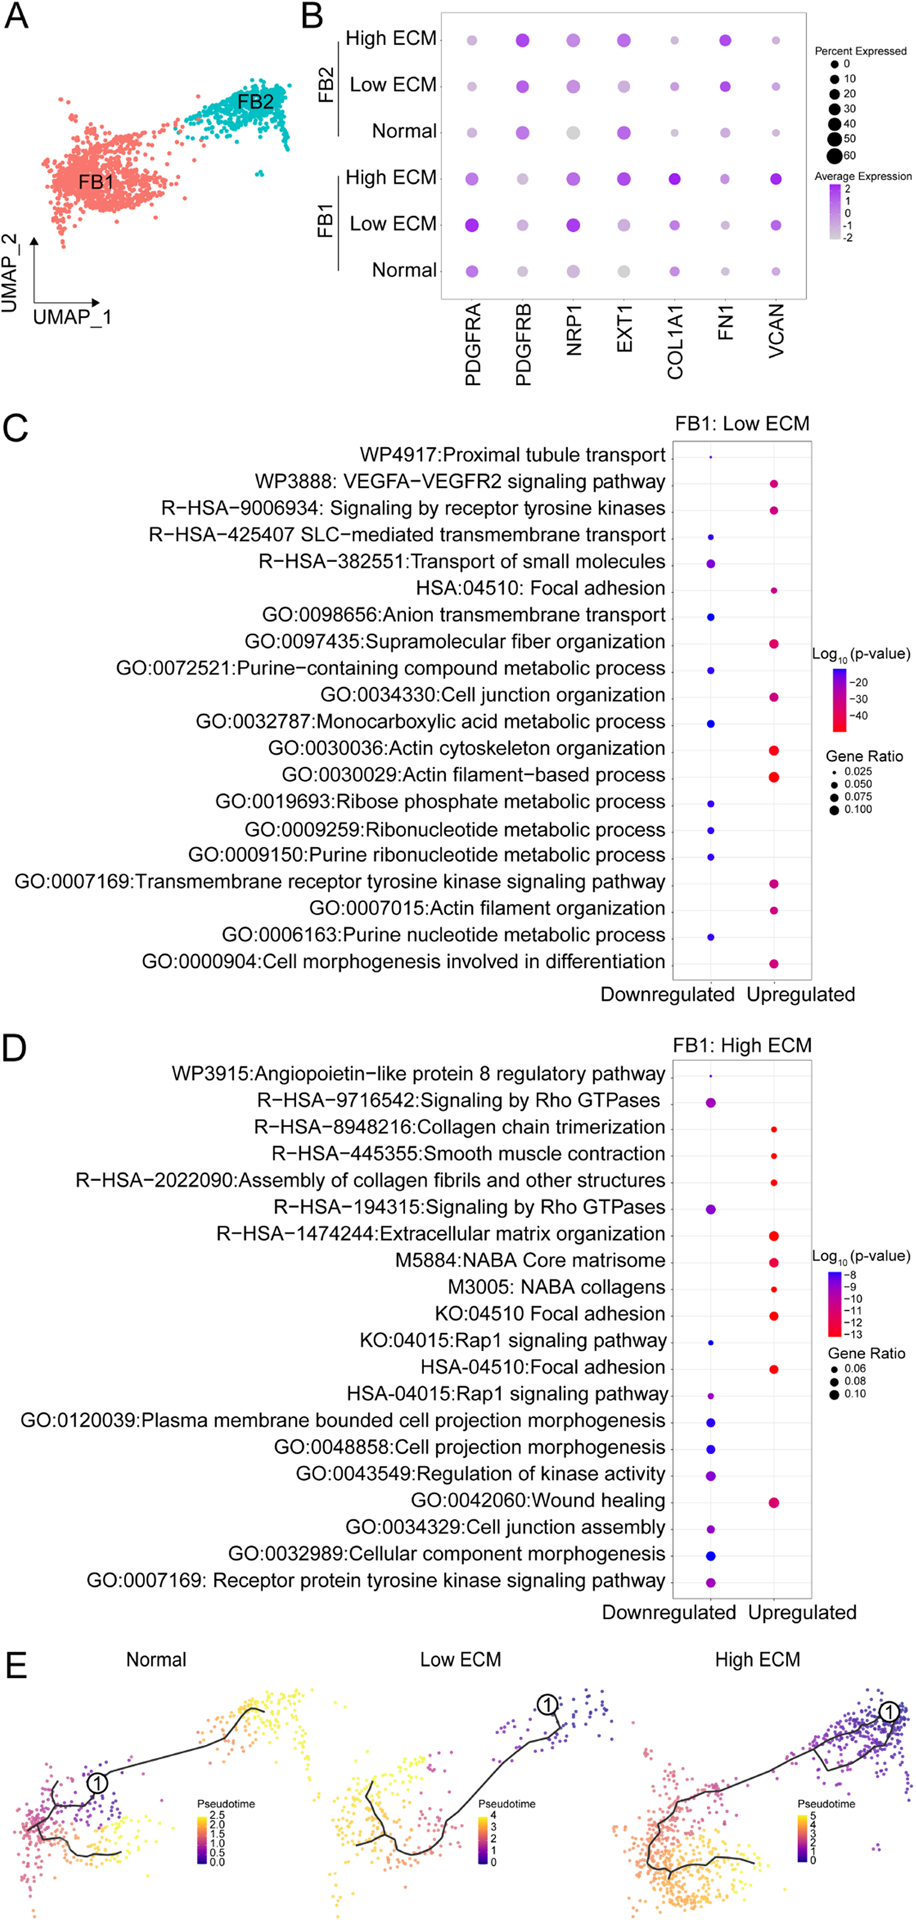
Fig. 4. Gene expression and trajectory analysis of fibroblast clusters.

(A) UMAP of FB1 and FB2. (B) Dot plot of DEGs to distinguish clusters. FB1 GO enrichment analysis for (C) low and (D) high ECM. Comparison of the GO terms by p-value and gene ratio (defines the number of DEGs in associated with the GO term). Analysis was performed with ggplot2 in R. (E) Individual trajectories along pseudotime for normal (left), low ECM (middle), and high ECM (right). Solid black line depicts the expression curves for each branch over pseudotime. Encircled one, origin of trajectory.
