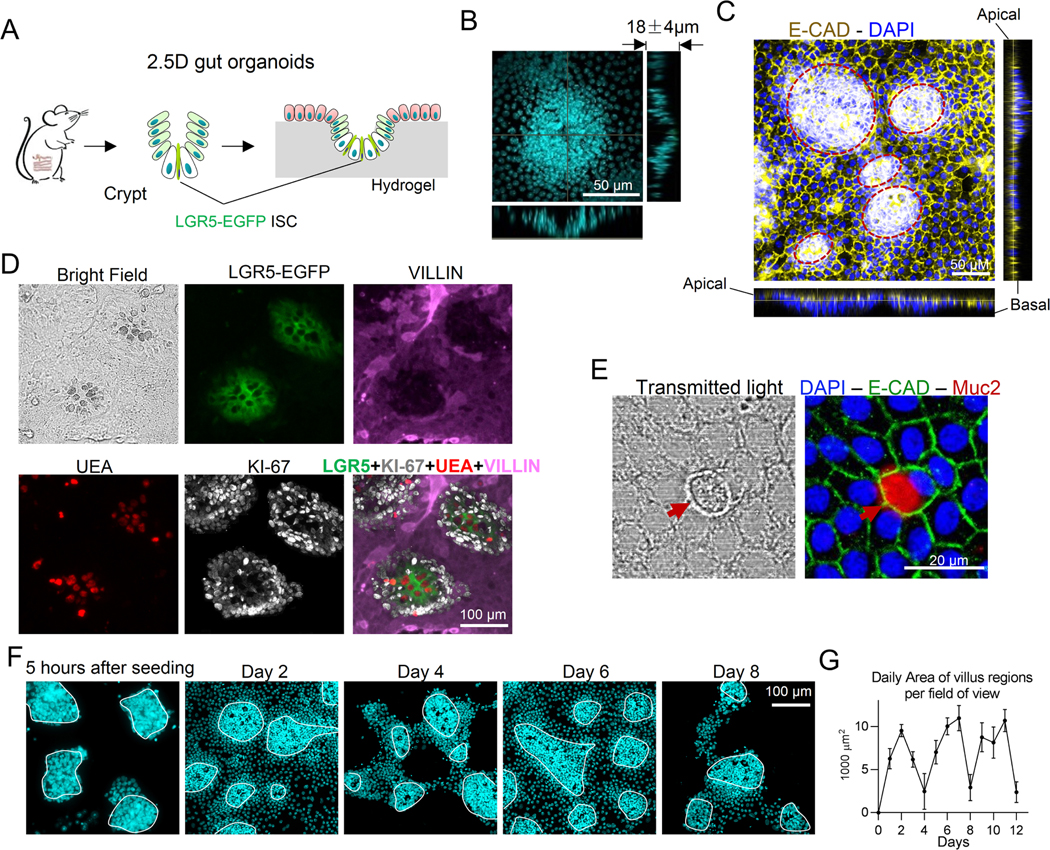
Figure 1. 2.5D gut organoids cultured on soft hydrogel matrices.
(A) Illustration of the experimental system. (B) Orthogonal projection of DAPI staining showing the invagination of crypt-like region with dense nuclei. Scale bar, 50 μm. (C) Orthogonal projection of E-cadherin staining showing a concentrated expression at the apical surfaces (n=3). The red dashed lines indicate crypt regions. Scale bar, 50 μm. (D) LGR5-EGFP+ ISCs were intermixed with the optically dark and UEA+ Paneth cells, which were surrounded by KI-67+ TA cells in the crypt-like regions. The villus-like regions were populated by villin+ differentiated cells (n=3). Scale bar, 100 μm. (E) The confocal transmitted light image showed distinguishable morphology of MUC2+ goblet cells (n=3). Scale bar, 20 μm. (F) DAPI staining showed that the villus-like regions exhibited a turnover rate of 3–4 days (n=5). The white contour lines indicate the crypt regions. Scale bar, 100 μm. (G) The area of villus regions was quantified daily. The error bars denote standard deviation.

