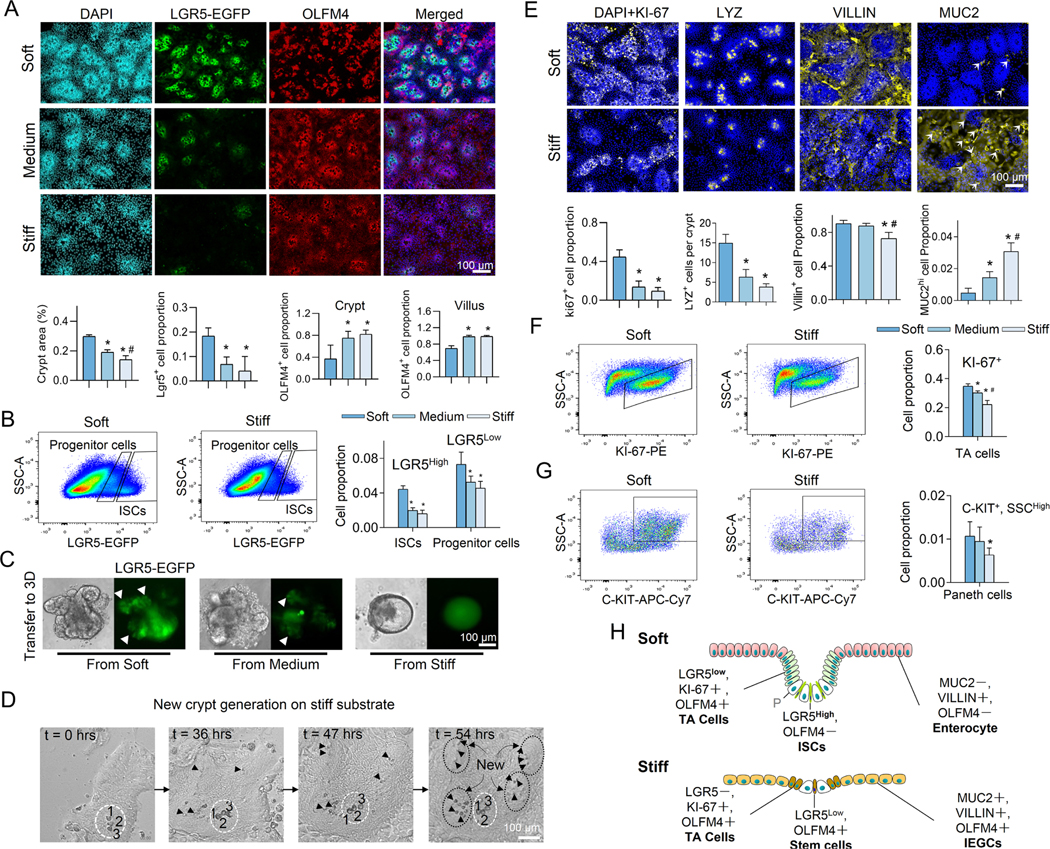
Figure 2. Stiffness determines the fate of ISCs.
(A) Increasing the matrix stiffness from soft (0.6kPa) to medium (2.4kPa) to stiff (9.6kPa) reduced the size of the crypt-like regions with dense nuclei and decreased the expression of LGR5. Stiffening also extended the OLFM4+ cells into villus-like regions. Scale bar, 100 μm. The crypt surface area was quantified as a proportion of total area, the number of LGR5+ cells as a proportion of total cells, and the number of OLFM4+ cells as a proportion of total cells in the crypt regions and in the villus regions. (n=3–5). (B) Flow cytometry analysis showed that stiffening decreased LGR5high ISCs and LGR5low progenitor cells (n=3). (C) The 3D organoids derived from the soft and medium matrix budded with LGR5-EGFP+ ISCs (white arrows). The 3D organoids derived from the stiff matrix grew more like LGR5-EGFP− cysts (n=3). Scale bar, 100 μm. (D) Live-cell imaging demonstrates the generation of new crypts in the villus-like region of the stiff substrate (Movie S2). At t=0 hrs, only one crypt is visible (labeled with a white dashed ellipse) surrounded by the villus region. The large and optically dark Paneth cells (enumerated by 1, 2 and 3) are used as a point of reference. At t=36 hrs, new Paneth cells (marked by black arrows) appear within the villus region. At t=47 hrs, more Paneth cells are visible within newly formed crypts. At t=54 hrs, four new, fully formed crypts (labeled with black dashed ellipses) are visible. Scale bar, 100 μm. (E) Stiffening decreased the expression of KI-67, LYZ, and VILLIN, but increased MUC2 (n=3–5). Scale bar, 100 μm. KI-67+, and VILLIN+ cells, and MUC2high cells (indicated by arrows) were respectively quantified as their proportion of total cells. LYZ+ cells is quantified as cell number per crypt. Flow cytometry analysis showed that stiffening decreased KI-67+ TA cells (F, n=3) and Paneth cells (G, n=6). (H) Schematic summarizing the impact of stiffening on all cell types. ‘P’, Paneth cell. * vs. Soft and # vs. Medium, P<0.05 (One-way ANOVA analysis). The error bars denote standard deviation.

