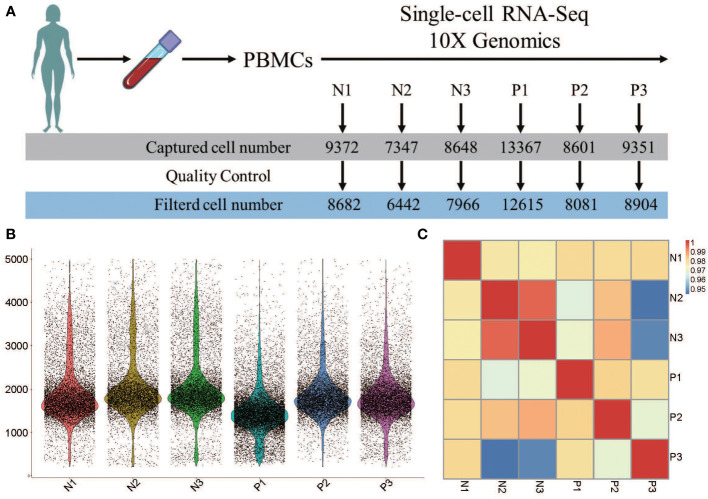
Figure 1.
Heterogeneity of PBMC population analysi by single-cell RNA-seq. (A) The number of single cells in each sample caputured by single-cell RNA-seq 10X genomics. (B) The violin plot shows the gene number of each sample. (C) Pearson’s correlation plot visulizaing the correlation values between samples.

