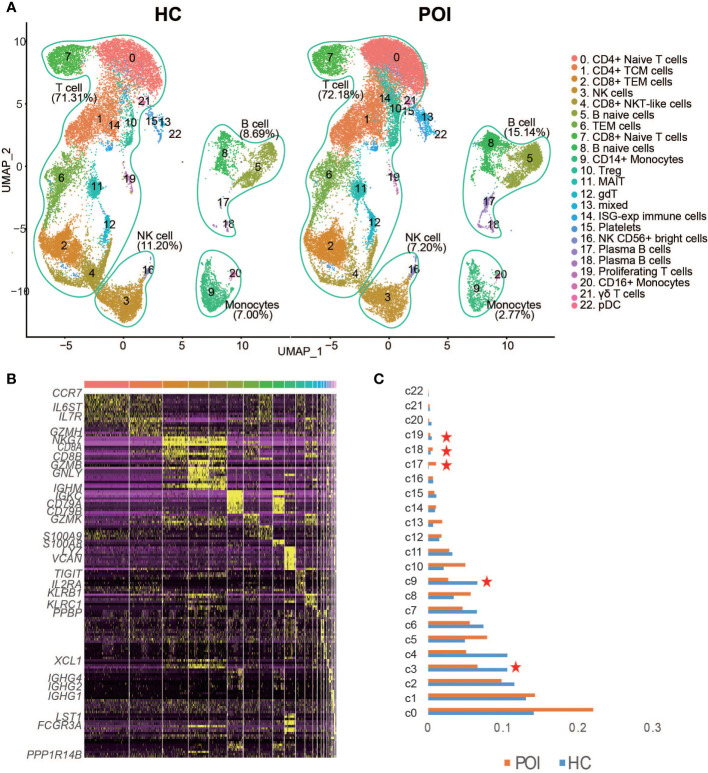
Figure 2.
Single-cell transcriptional profiling of PBMCs from POI and HC. (A) Two- dimensional representation of cell types identified by scRNA-seq. (B) Heatmap of the top 10 marker genes from each cluster. (C) The proportion of each cluster in POI group compared with the HC group. Red star indicates statistical significance.

