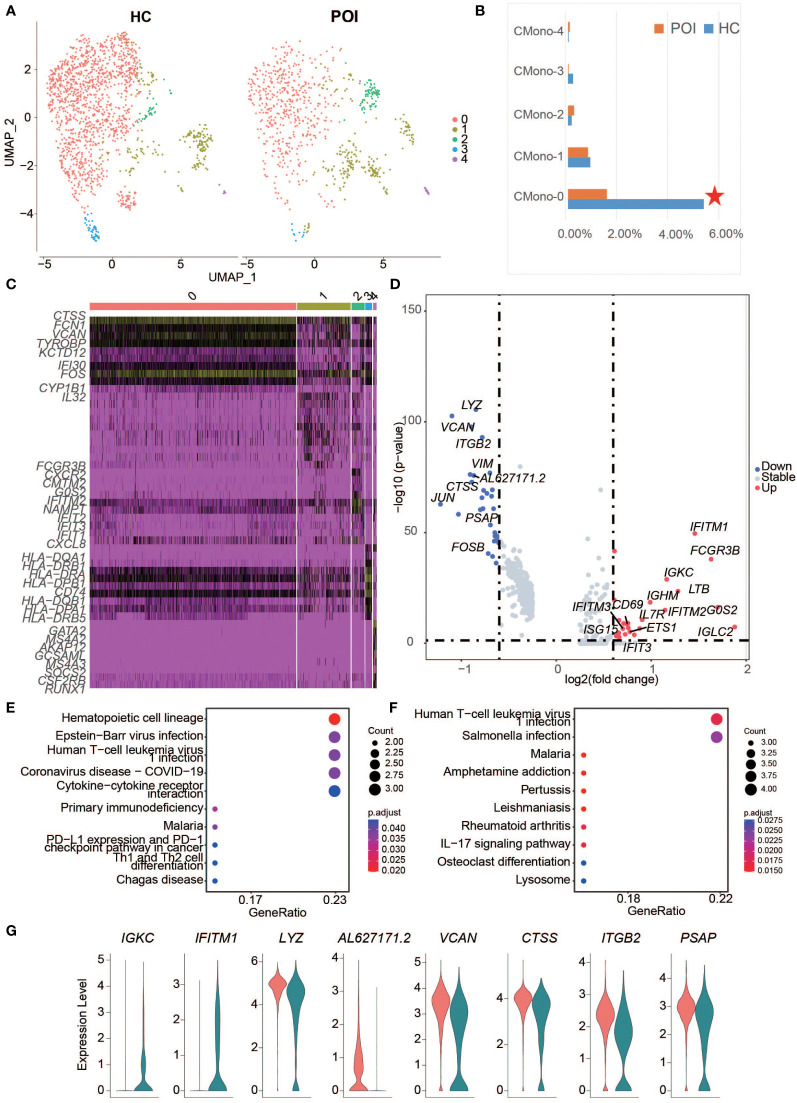
Figure 4.
Single-cell expression analysis of monocytes in POI and HC. (A) UMAP plot showing five cell subclusters from the monocyte cells in POI and HC. (B) The proportion of each subclusters of monocytes in POI and HC, Red star indicates statistical significance. (C) The heatmap of top 10 marker genes in each subclusters of monocytes. (D) The DEGs of monocytes between POI and HC. (E, F). Dot plot of enriched KEGG terms of the down-regulated (E) and up-regulated genes (F, G) Violin plots for some marker genes in classical monocytes.

