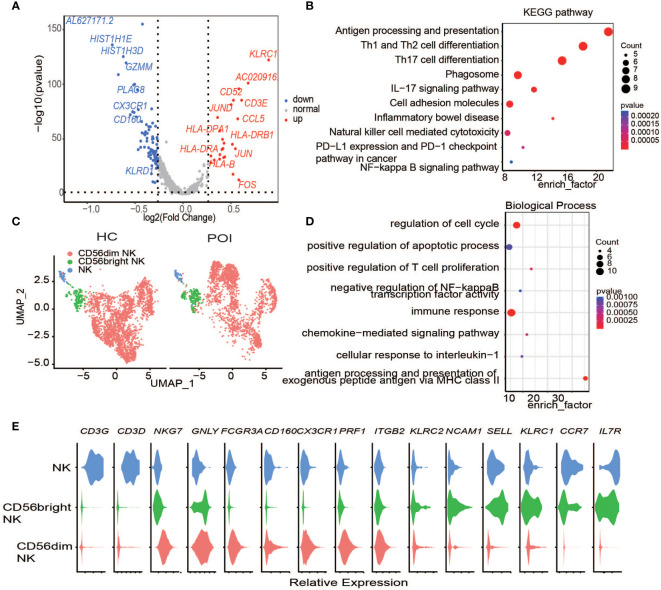
Figure 5.
Single-cell expression analysis of Natural Killer cells in POI and HC. (A) The DEGs of NK cells between POI and HC. (B) Dot plot of enriched KEGG terms of the DEGs. (C) UAMP plot showing the NK cell subclusters in POI and HC. (D) Dot plot of enriched Biological of the DEGs. (E) Violin plots for classical markers of NK cell clusters.

