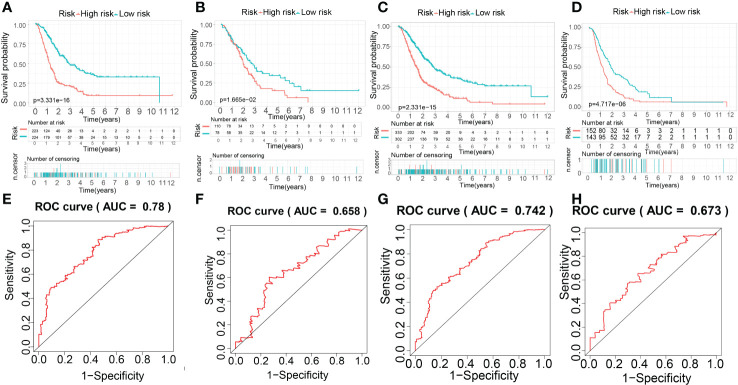
Figure 11.
The establishment and evaluation of the prognostic performance of the MTG-RPS. (A–D) Survival curve of overall survival time between low- and high-risk patients of the MTG-RPS in the train, test1, test2, and test3 cohort. (E–H) ROC curve of 5 years between low- and high-risk patients of the MTG-RPS in the train, test1, test2, and test3 datasets with the area under the curve (AUC) of 0.780, 0.658, 0.742, and 0.673, respectively.

