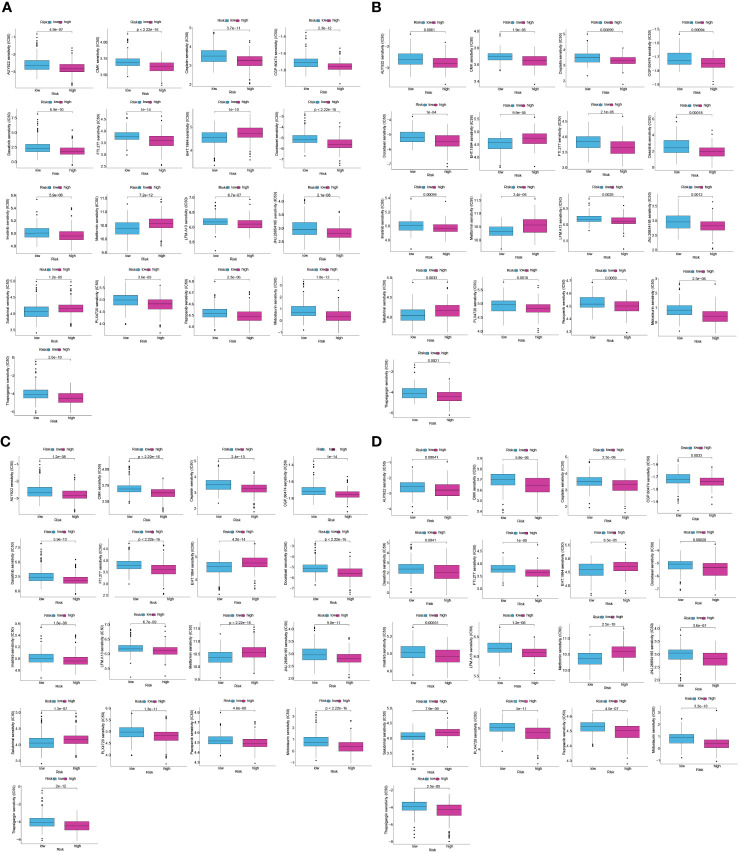
Figure 12.
Difference in drug sensitivity between low and high-risk patients in train, test1, test2, and test3 cohorts. The box plot for the estimated IC50 of 12 different types of regularly used chemotherapy regimens conducted in (A–D), (A–D) for low-risk (blue) and high-risk patients (purple). The 17 types of chemotherapeutic agents are AUY922, CGP.60474, cisplatin, CMK, dasatinib, docetaxel, EHT.1864, FTI.277, imatinib, JNJ.26854165, LFM.A13, metformin, midostaurin, pazopanib, PLX4720, salubrinal, and thapsigargin. On top of each cluster, the corresponding p-values are shown, and the P< 0.05 denotes the significance level.

