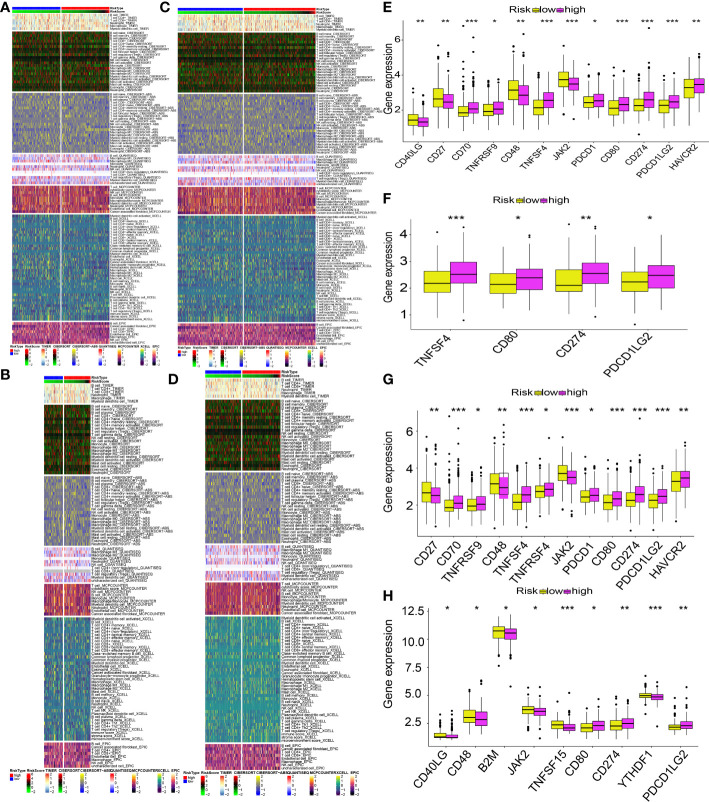
Figure 13.
MTG-RPS-based analysis of tumor immune microenvironment. (A–D) Comparisons of low- and high-risk groupings in the train, test1, test2, and test3 cohorts revealed distinct patterns of immune cell infiltration, as shown by the heat maps. (E–H) Immune checkpoint expression varied across low- and high-risk groupings throughout the train, test1, test2, and test3 cohorts, as depicted by the box plots. (* designates p<0.05; ** signifies p< 0.01; *** designates p< 0.001).

