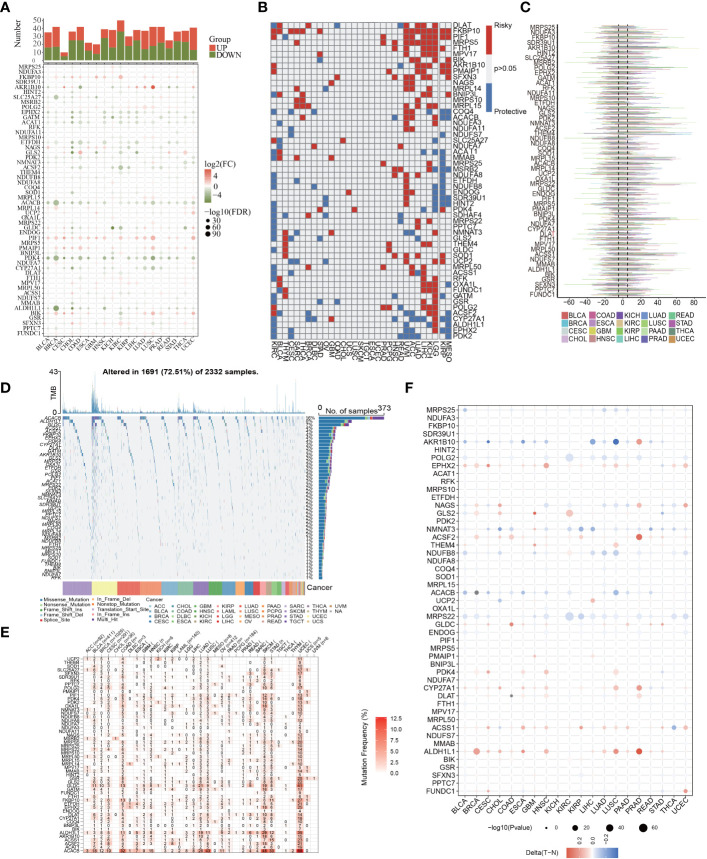
Figure 3.
Pan-cancer characterization of 56 differentially expressed MTGs-OS. (A) The expression characteristics of 56 MTGs-OS in other malignant tumors (P<0.05). (B) Survival profiles of the MTGs-OS pan-cancer. Genes with P > 0.05 are highlighted in white, whereas the risk and protective genes are denoted by the red and blue colors, correspondingly. (C) Gain and loss frequencies of CNVs in the 56 MTGs-OS in various cancers. The frequency variation of MTGs-OS in pan-cancers is shown by the line’s length. (D, E) SNV data of the 56 MTGs-OS depicted in pan-cancers by heatmap and waterfall plot. (F) The DNA methylation of 56 MTGs-OS in pan-cancers (the gradient from red to blue represents a decline from a high to a low level).

