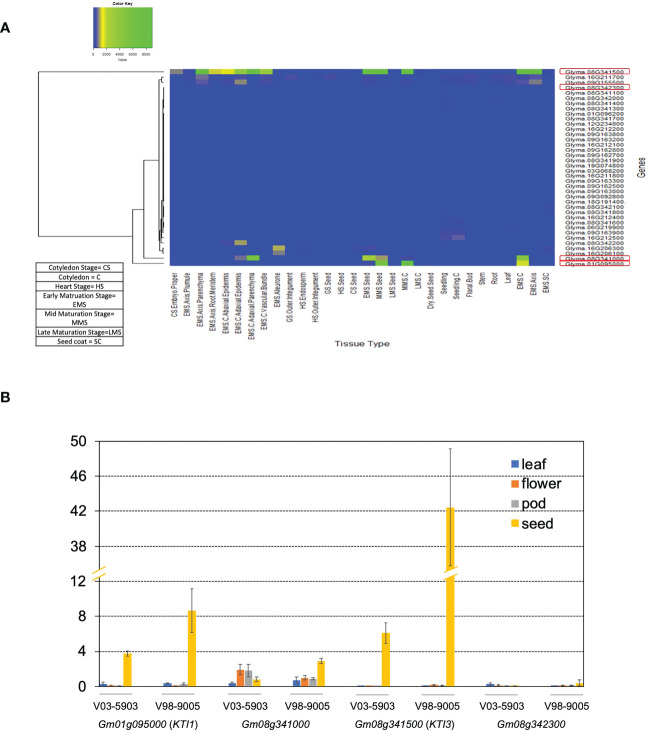
Figure 1.
Expression levels of KTI genes in WM82. (A) RNA sequencing data of 38 KTI genes in 30 different tissue types of cv. Williams 82 acquired from Phytozome soybean database was used to construct the heatmap to visualize their expression patterns. (B) The expressions of four soybean KTI genes were monitored by real-time PCR. Samples of leaf, flower, pod, and seed tissues from 2 breeding lines, V98-9005 (normal-TI line) and V03-5903 (low-TI line), were collected for RNA extraction. After reverse transcription, real-time PCR was used to evaluate the expressions of 4 genes including Gm01g095000, Gm08g341000, Gm08g342300, and Gm08g341500 in different tissues with the ELF1B (Gm02g276600) as the reference gene. The expression data was normalized as ΔCT and shown as mean ± s.e. Experiments were repeated three times and obtained similar results.

