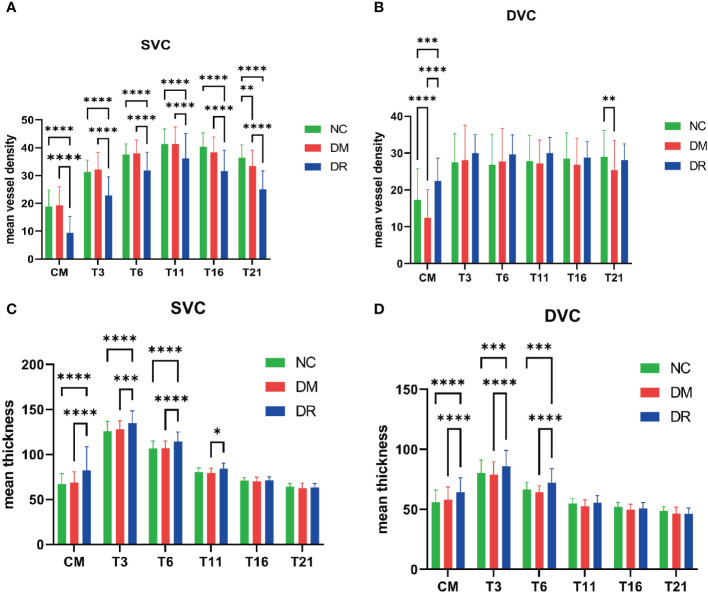
Figure 4.
Vascular density (VD) and thickness analysis of the superficial vascular complex (SVC) and deep vascular complex (DVC). (A) Compared with the normal control (NC) group, the average VDs of the SVC were significantly lower in all retinal areas of patients with diabetic retinopathy (DR), as well as being significantly lower in the temporal fan-shaped area of 16–21 mm (T21) in patients with diabetes mellitus (DM). (B) The average VDs of the DVC in the central macula (CM) and T21 were lower in DM patients; although the average VDs of the DVC in all areas were higher in DR patients, only the changes in the CM were statistically significant. (C) The average thicknesses of SVC nourishing segments did not differ significantly in the NC and DM groups. The average thicknesses of these segments in the CM and temporal fan-shaped areas of 1–3 mm (T3), 3–6 mm (T6), and 6–11 mm (T11) were significantly greater in the DR than in the DM group. (D) The average thicknesses of DVC nourishing segments did not differ significantly in the NC and DM groups. The average thicknesses of these segments in the CM, T3, and T6 were significantly greater in the DR than in the DM group. *p < 0.05, **p < 0.01, ***p < 0.001, and ****p < 0.0001.

