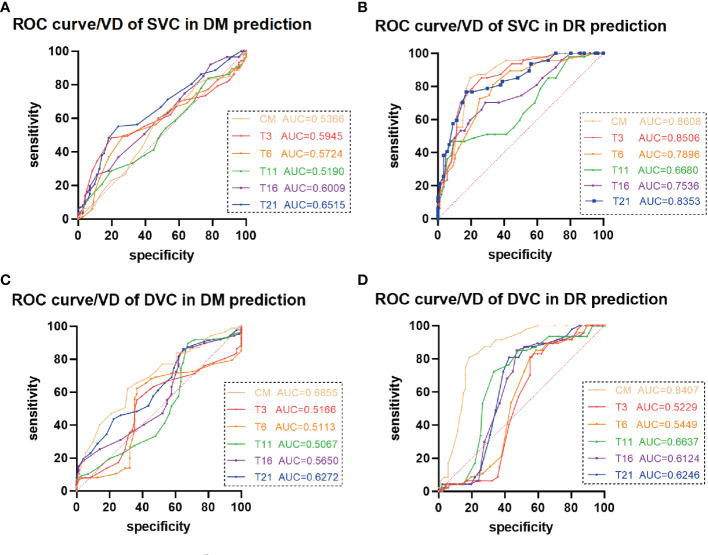
Figure 5.
Receiver operating characteristic (ROC) curve analysis of vascular density (VD) in patients with diabetes mellitus (DM) and diabetic retinopathy (DR). (A, C) The average VDs of the (A) superficial vascular complex (SVC) and (C) deep vascular complex (DVC) showed poor ability to predict DM. (B) The average VDs of the SVC in the central macula (CM) and temporal fan-shaped areas of 1–3 mm (T3) and 16–21 mm (T21) revealed better ability to predict DR. (D) The average VD of the DVC in the CM revealed ability to predict DR.

