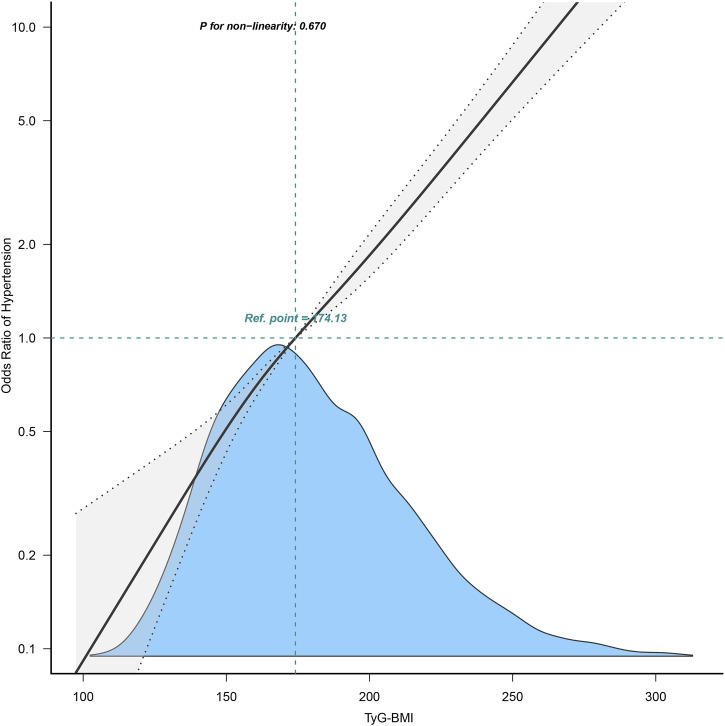
Figure 2.
Odds ratios (ORs) were adjusted for age (continuous), sex (male or female), waist circumference (<90 or ≥90 in Men and <80 (cm) ≥80 in Women), smoking status (never, past and current), alcohol consumption (none, light, moderate and heavy), total cholesterol (continuous) and triglyceride (continuous). Both p linearity, 0.001.

