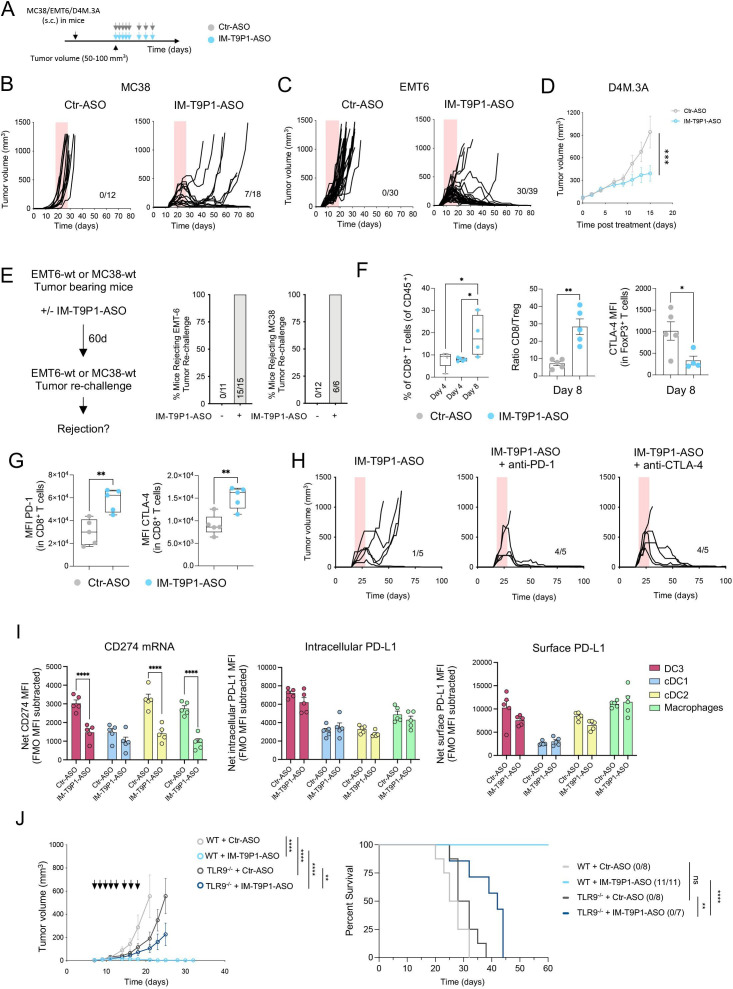
Figure 3.
IM-T9P1-ASO therapeutic in vivo efficacy depends on both TLR9 stimulation and PD-L1 downregulation. (A) Diagram of tumor-bearing mice receiving Ctr-ASO or IM-T9P1-ASO. (B) Tumor growth of MC38 tumor-bearing mice treated with Ctr-ASO or IM-T9P1-ASO (n=12–18 mice/group). The number of tumor-free mice is shown. (C) Tumor growth of EMT6 tumor-bearing mice treated with Ctr-ASO or IM-T9P1-ASO (n=30–39 mice/group). The number of tumor-free mice is indicated. (D) Average tumor growth of D4M.3A tumor-bearing mice receiving Ctr-ASO or IM-T9P1-ASO (n=7–8 mice/group). (E) Mice cured with IM-T9P1-ASO were rechallenged with the same tumor entity in the contralateral flank. The percentage of mice rejecting the tumor engraftment is shown. Naïve mice were used as controls for tumor growth (n=6–15 mice/group). (F) Flow cytometry quantification of CD8+ T cells (left), CD8+ to FoxP3+ CD4+ T-cell ratio (middle) and CTLA-4 expression in FoxP3+ CD4+ T cells (right) in MC38 tumors at the indicated time points and therapies (n=4–5 mice/group). (G) Flow cytometry analysis of CD8+ T cells in MC38 tumors 8 days after indicated treatment (n=5 mice/group). (H) Tumor growth of MC38 tumors with treatment initiation at large tumor size (~150 mm3) with IM-T9P1-ASO alone or in combination with anti-programmed cell death protein-1 or anti-CTLA-4 mAb (n=5 mice/group). The number of tumor-free mice is shown. (I) Combined in situ hybridization and flow cytometry analysis of MC38 tumors 2 days after Ctr-ASO or IM-T9P1-ASO treatment, showing PD-L1 mRNA (left), intracellular protein (middle) and surface protein (right) expression in the indicated cell types (n=5 mice/group). (J) Average tumor growth (left) and overall survival (right) of MC38 tumor-bearing WT and TLR9–/– mice treated with Ctr-ASO or IM-T9P1-ASO (n=7–11/group). The number of tumor-free mice is indicated. Data are presented as mean±SEM. For comparisons between two groups, Student’s two-tailed t-test was used. For comparisons between multiple groups and variables, two-way analysis of variance was used. For survival analyses, the Mantel-Cox log-rank test was used. *p<0.05, **p<0.01, ***p<0.001, ****p<0.0001. ASO, antisense oligonucleotides; cDC, conventional DC; CTLA-4, cytotoxic T-lymphocytes-associated protein 4; DC, dendritic cell; FMO, fluorescence minus one; MFI, mean fluorescence intensity; mRNA, messenger RNA; PD-L1, programmed cell death ligand 1; s.c., subcutaneously; WT, wild-type; TLR9, toll-like receptor 9.

