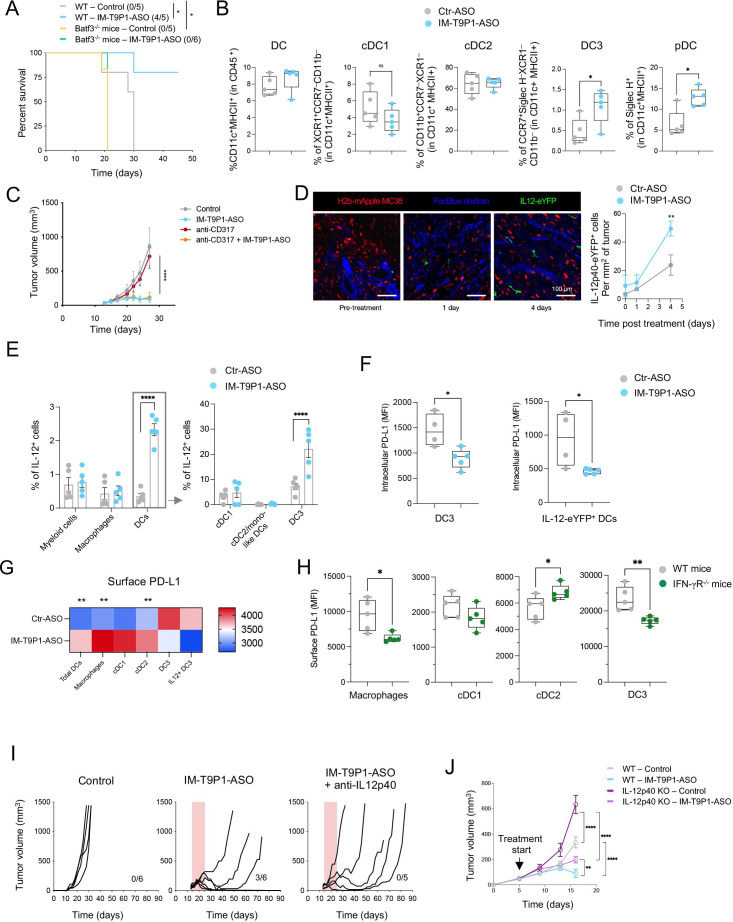
Figure 5.
IM-T9P1-ASO increases intratumoral IL-12+ DC3s. (A) Kaplan-Meier survival curve of MC38 tumor-bearing WT or Batf3–/– mice treated with Ctr-ASO or IM-T9P1-ASO (n=5–6 mice/group). The number of tumor-free mice is indicated in brackets. (B) Flow cytometry analysis of the indicated DC subsets in MC38 tumors 2 days after indicated treatment (n=5 mice/group). (C) Average tumor growth of MC38 tumor-bearing mice treated with IM-T9P1-ASO both in the presence and absence of pDC depletion antibody CD317 (n=3–6 mice/group). (D) Intravital analysis of MC38-mApple tumors in IL-12p40-eYFP reporter mice treated with Ctr-ASO or IM-T9P1-ASO (n=3 mice/group). Left: representative microscopy images (green, IL-12p40-eYFP-expressing cells; red, tumor cells; blue, Pacific Blue-labeled vasculature). Right: quantification of IL-12p40-eYFP+ cells up to 4 days after treatment. (E) Flow cytometry analysis of IL-12+ cells in the indicated cell subsets in MC38 tumors of WT mice 3 days after indicated treatment (n=5 mice/group). (F) Flow cytometry analysis of PD-L1 expression in DC3s (left) and IL-12p40-eYFP+ DCs (right) in MC38 tumors of IL-12p40-eYFP reporter mice 3 days after indicated treatment (n=4–5 mice/group). (G) Flow cytometry-based heatmap showing the average PD-L1 expression on the surface of the indicated cell types in MC38 tumors 4 days after IM-T9P1-ASO therapy (n=5 mice/group). (H) Flow cytometry analysis of the PD-L1 surface expression in the different intratumoral cell subsets indicated in wildtype and IFN-γR deficient mice (n=5 mice/group) bearing MC38 tumors. (I) Tumor growth of MC38 tumors during IL-12 neutralization in presence of IM-T9P1-ASO therapy using anti-IL-12p40 neutralizing mAb (n=5–6 mice/group). The number of tumor-free mice is indicated. (J) Average tumor growth of D4M.3A tumor-bearing WT and IL-12p40–/– mice treated with Ctr-ASO or IM-T9P1-ASO (n=7–9 mice/group). Data are presented as mean±SEM. For comparisons between two groups, Student’s two-tailed t-test was used. For comparisons between multiple groups and variables, two-way analysis of variance was used. For survival analyses, the Mantel-Cox log-rank test was used. *p<0.05, **p<0.01, ***p<0.001, ****p<0.0001. ASO, antisense oligonucleotides; cDC, conventional DC; DC, dendritic cell; IFN, interferon; IL, interleukin; MFI, mean fluorescence intensity; MHC, major histocompatibility complex; pDC, plasmacytoid DC; PD-L1, programmed cell death ligand 1; WT, wild-type.

