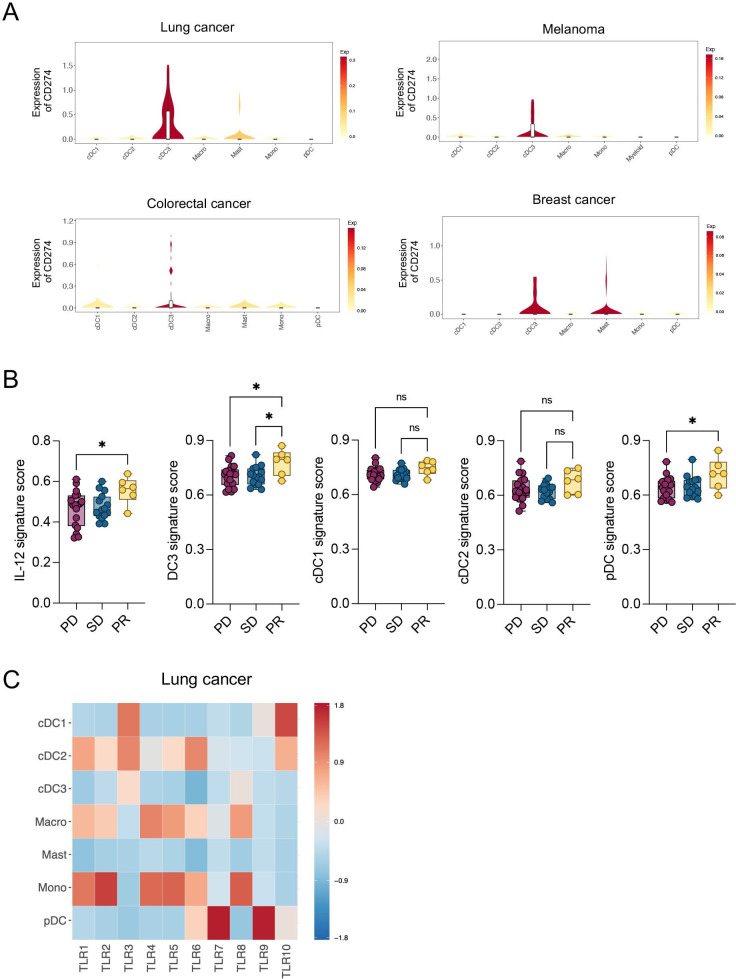
Figure 6.
CD274 and TLR expression across human myeloid population and signatures enrichment in patients with melanoma. (A) Violin plots showing mRNA expression of CD274 across indicated myeloid populations in different tumor entities.19 Top-left: lung cancer; top-right: melanoma; bottom-left: colorectal cancer; bottom-right: breast cancer. (B) Enrichment analysis of IL-12, DC3, cDC1, cDC2 and pDC gene signatures (derived from29 and12 in tumor biopsies of patients with melanoma (n=42) before nivolumab treatment.31 Patients are classified according to their response to nivolumab therapy as progressive disease (PD), stable disease (SD) and partial response (PR). (C) Heatmap showing mRNA expression of TLRs across indicated myeloid populations in patients with lung cancer.19 Data are presented as mean±SEM. For comparisons between multiple groups, one-way analysis of variance was used. *p<0.05, **p<0.01, ***p<0.001, ****p<0.0001. cDC, conventional DC; DC, dendritic cell; IL, interleukin; mRNA, messenger RNA; ns, not significant; pDC, plasmacytoid DC; TLR, toll-like receptor.

