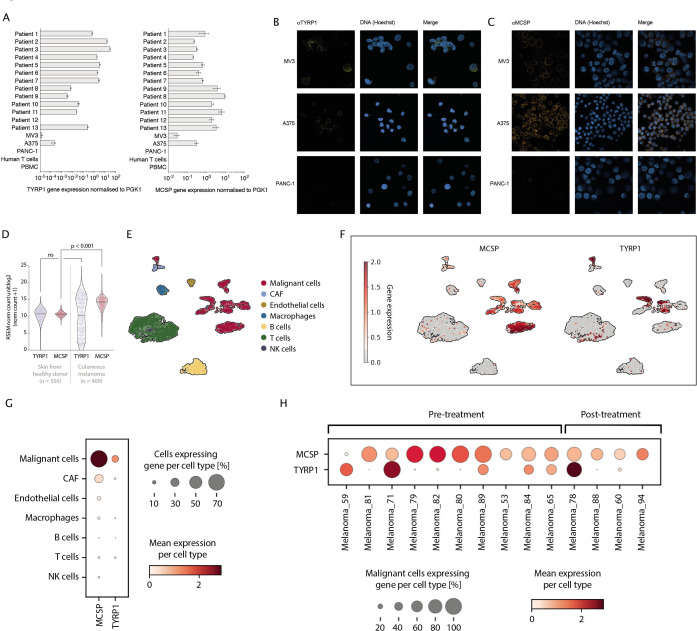
Figure 1.
MCSP and TYRP1 are differentially expressed on melanomas. (A) RT-PCR MCSP and TYRP1 gene analysis of human melanoma cell lines, patient-derived melanomas and controls. (B) Microscopic analysis of TYRP1 expression on permeabilized MV3, A375 and PANC-1 cells using αTYRP1/αE3 BiAb (αTYRP1) and anti-human IgG secondary antibody. (C) Microscopic analysis of MCSP expression on MV3, A375 and PANC-1 cells using αMCSP/αE3 BiAb (αMCSP) and anti-human IgG secondary antibody. (D) TCGA analysis of RNA-seq expression of TYRP1 and MCSP in skin from healthy donors and cutaneous melanoma (cutaneous melanoma: n=469; skin from healthy donor: n=556). Scales are depicted in a log2 scale and messenger RNA normalization was estimated by the TCGA using the RSEM (RNA-seq by expectation maximization) method. (E) UMAP showing 3993 (following quality control) healthy and malignant cells from 19 previously published patients (GSE72056). Normalized gene expression values were logarithmized. Colors highlight the different cell types. Annotations of cells were provided by the authors of the respective study. (F) Expression of MCSP and TYRP1 in different cell types. Normalized gene expression values were log-transformed and visualized in a UMAP embedding. (G) Expression of MCSP and TYRP1 per cell type. Color intensity indicates mean gene expression per cell type, dot size indicates the proportion of cells expressing the respective gene per cell type. Normalized expression values were log-transformed. (H) Expression of MCSP and TYRP1 across 14 samples from melanoma patients pre-treatment or post-treatment. Color intensity indicates mean gene expression per patient, dot size indicates the proportion of malignant cells expressing the respective gene per patient. Normalized expression values were log-transformed. Statistical analysis in (D) was performed with the unpaired two-tailed Student’s t-test. Experiments in subfigure (A) show mean values±SD calculated from three replicates, violin plots and the median values in (D) calculated from n independent biological replicates. Experiments in subfigures (B) and (C) show one representative of two independent experiments. CAF, cancer-associated fibroblast; MCSP, melanoma-associated chondroitin sulfate proteoglycan; NK, natural killer; PBMC, peripheral blood mononuclear cell; PGK1, phosphoglycerate kinase 1; RNA-seq, RNA sequencing; TCGA, The Cancer Genome Atlas; TYRP1, tyrosinase-related protein 1; RSEM, RNA-seq by expectation maximization.

