
Fig. 1.
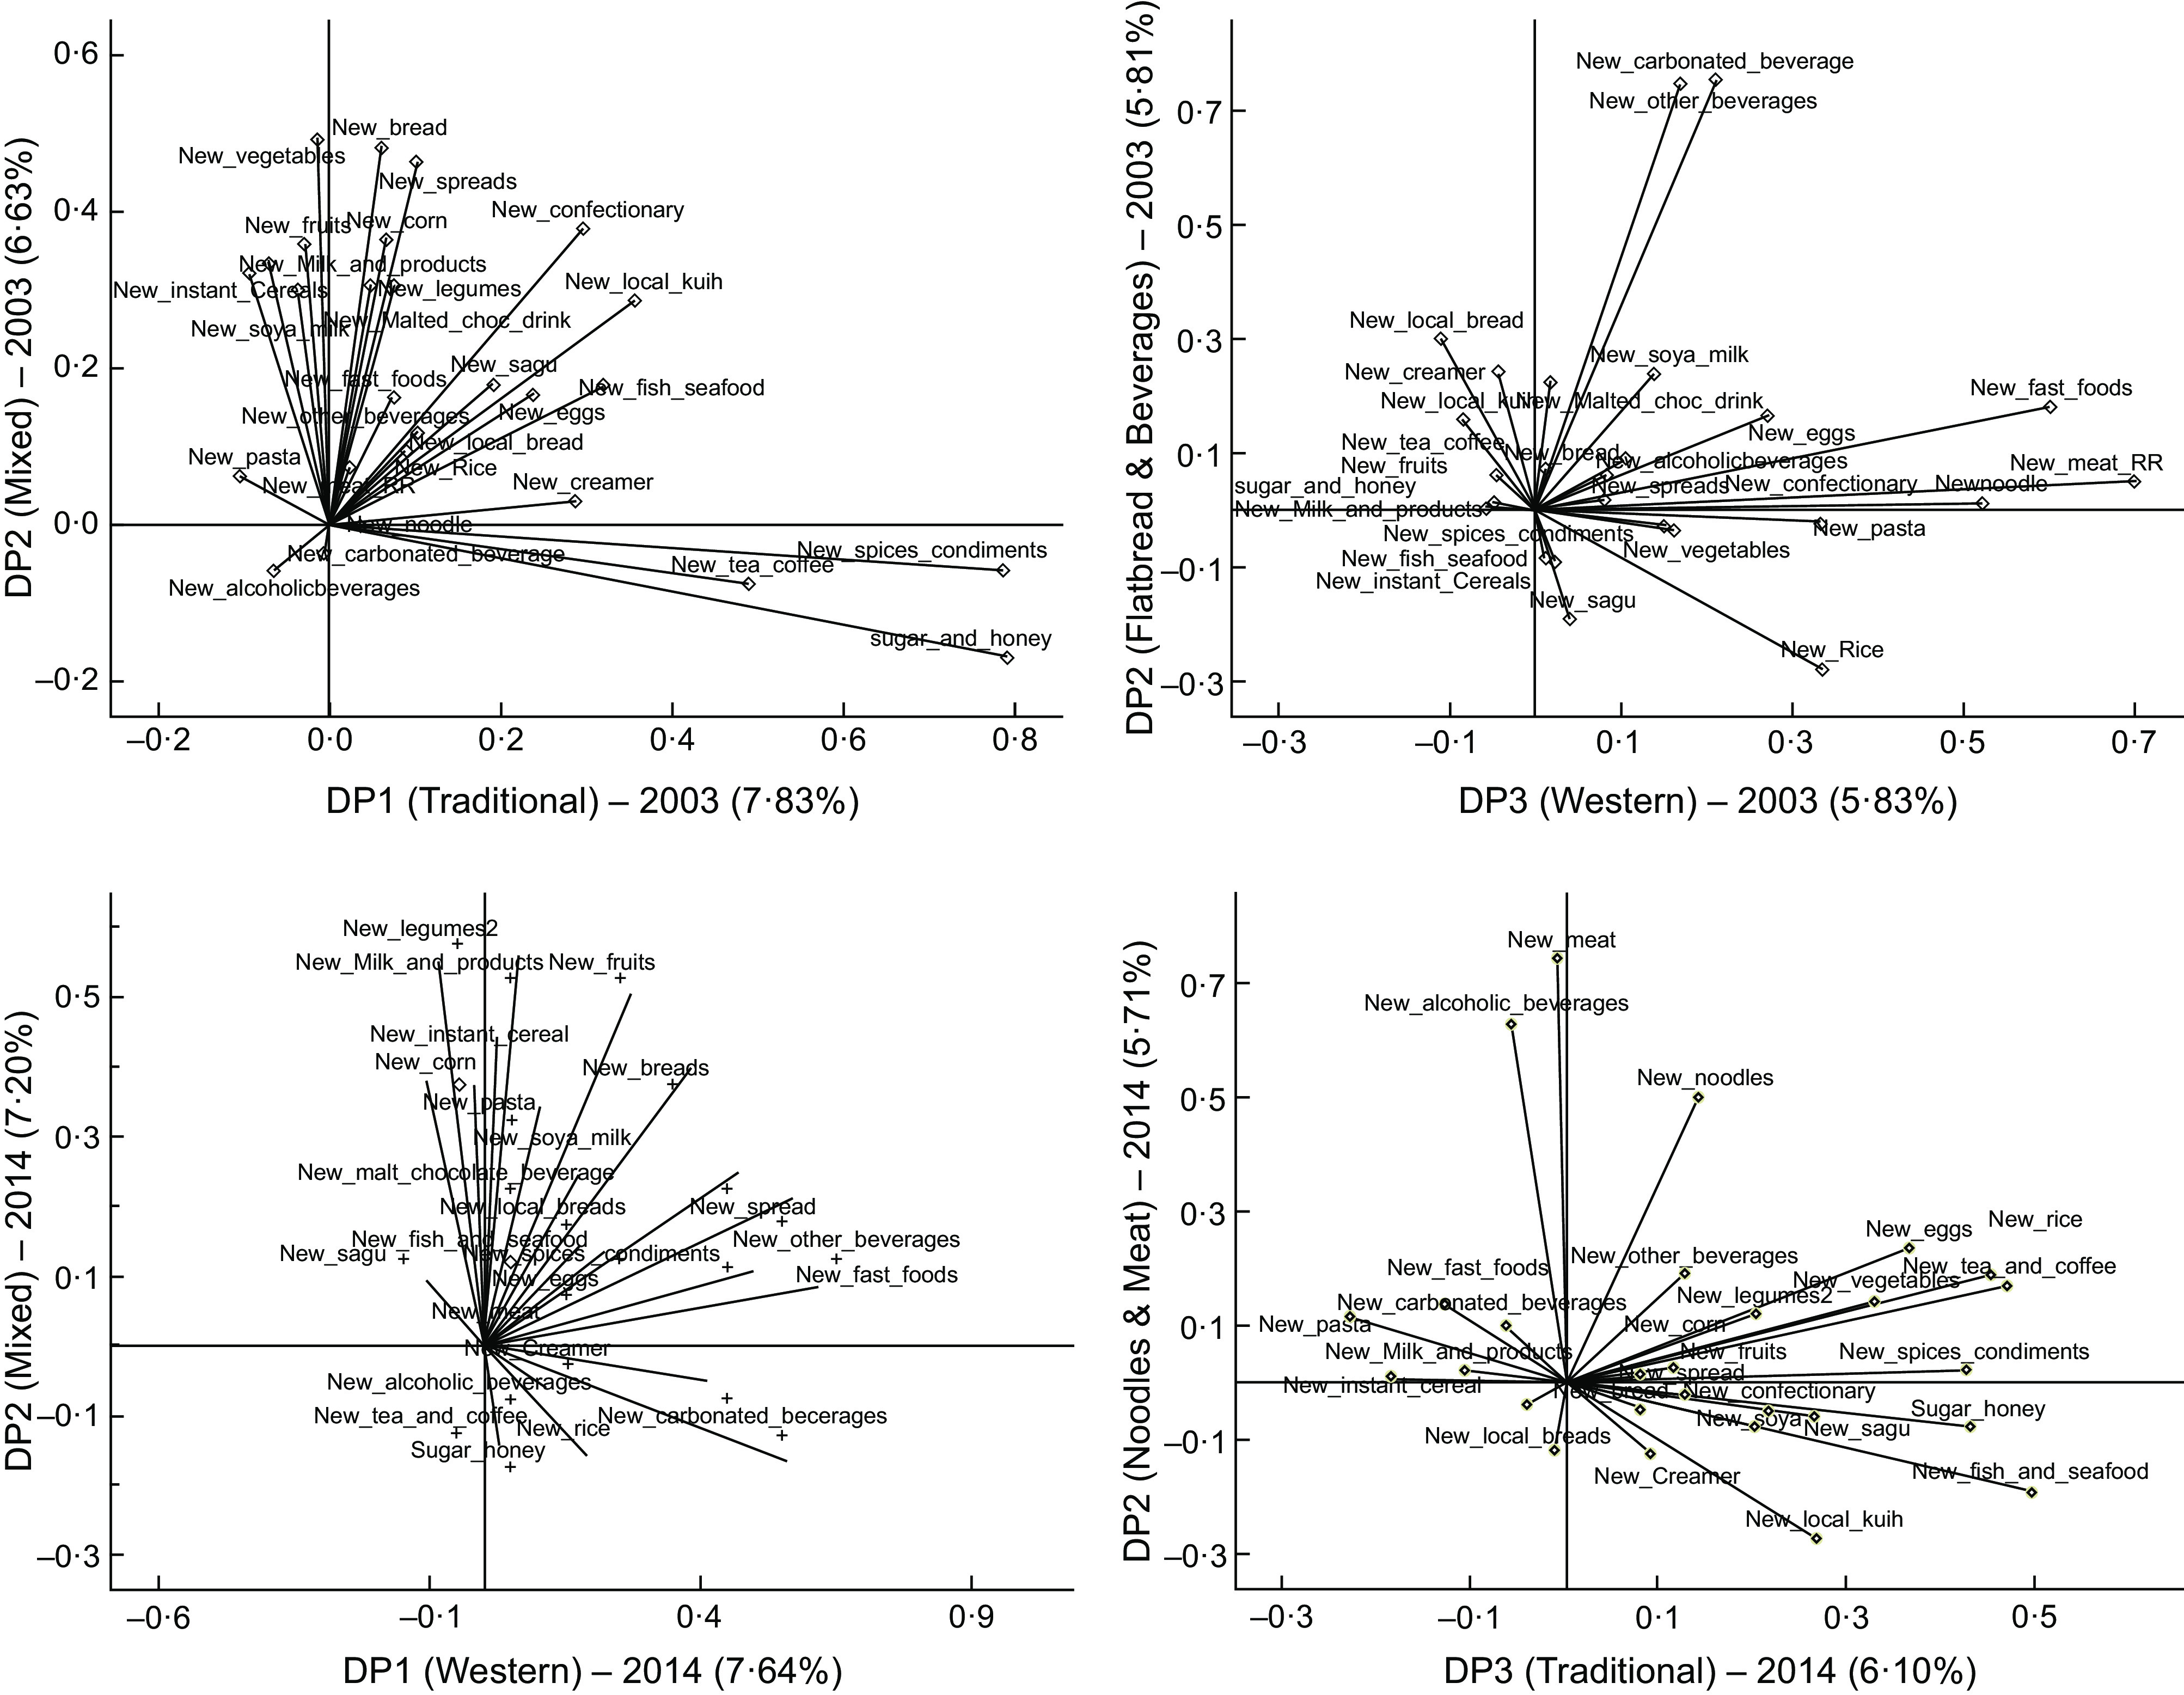
Rotated component loading plots showing the clustering of food groups for the four dietary patterns (DP) derived by principal component analysis from the Malaysian Adult Nutrition Survey (MANS) 2003 and 2014 FFQ. The left column shows the loading plots with DP1 on the x-axis and DP2 on the y-axis; the right column shows the loading plots with DP3 on the x-axis and DP4 on the y-axis. The top row visualises the data from MANS 2003 and the bottom row the data from MANS 2014