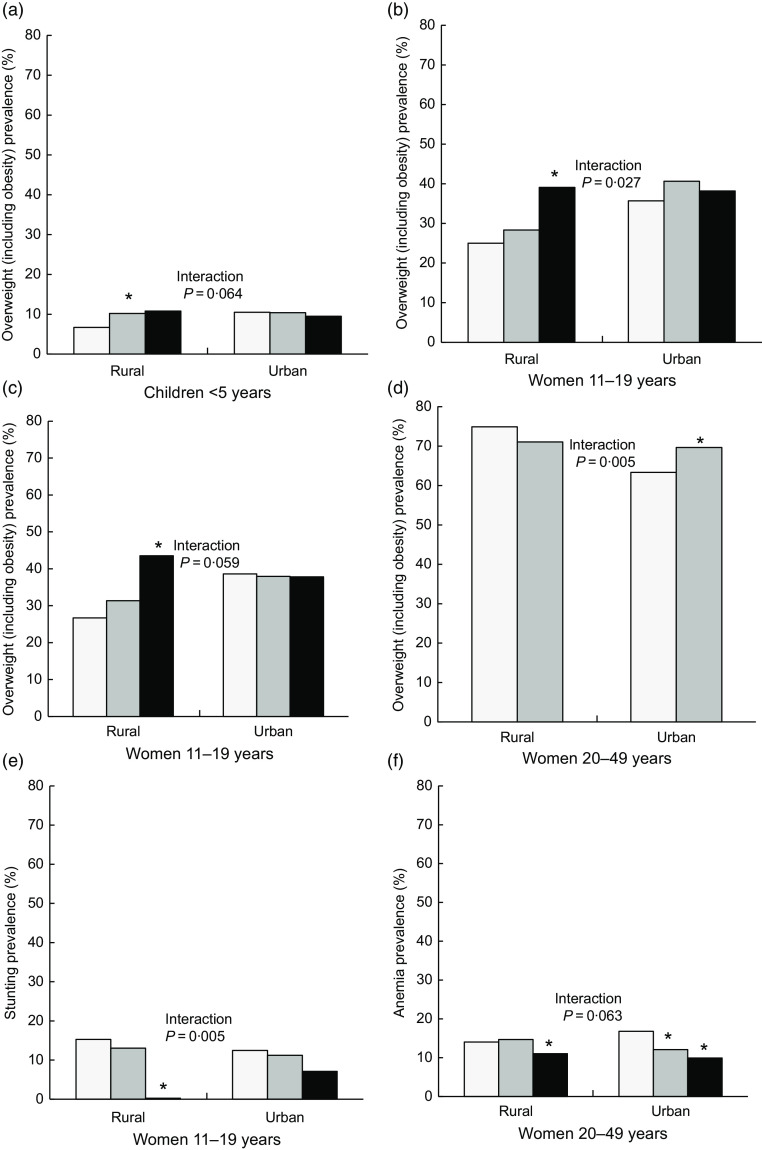
Fig. 1.
Predicted prevalence of malnutrition by wealth, education and ethnicity across rural and urban populations. Predictions based on a model that included wealth, education, ethnicity and an interaction term between each of these and urban/rural areas (one model per interaction term). *P < 0·05 v. reference category (low wealth, low mother’s education or indigenous). Results are only presented for models in which the interaction term had a P < 0·10. Data are from the Mexican National Health and Nutrition Survey 2012 (n 33 244). (a, b, f)  , low wealth;
  , medium wealth;
  , high wealth; (c, e)
  , low mother’s education;
  , medium mother’s education;
  , high mother’s education; (d)
  , indigenous;
  , non-indigenous

