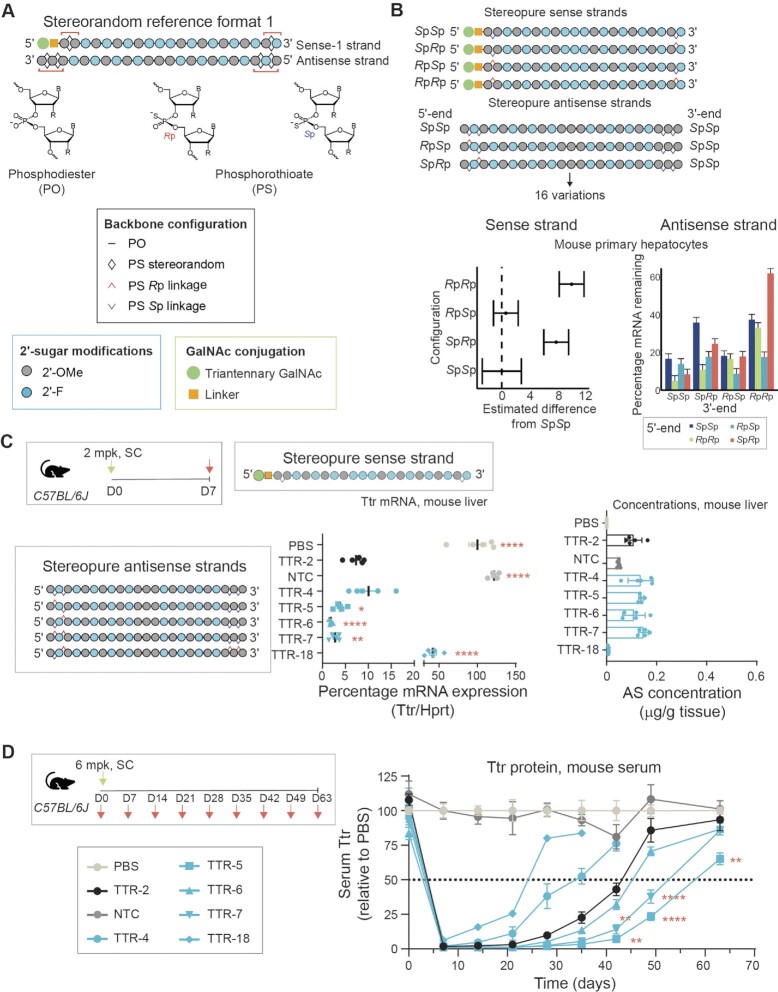
Figure 1.
Application of chiral control over PS modification to siRNA. (A) General design of siRNAs showing stereorandom reference format-1 (30) with GalNAc-modified sense strand (5’-end), with 2’-F and 2’-OMe ribose modifications and terminal stereorandom PS modification on each end (red brackets). Antisense (AS) strands have two terminal stereorandom PS modifications on each end (red brackets). Chemical structures for phosphodiester (PO) and phosphorothioate (PS) backbones are also shown along with legend for chemical modifications. (B) Application of PS stereochemistry to sense and antisense strands based on stereorandom reference format 1 in mouse primary hepatocytes. We generated 4 stereopure sense strands and 16 stereopure antisense strands with all possible combinations of Rp and Sp in the PS-modified positions shown in A. Forest plot showing summary of silencing data on 64 siRNAs (4 sense × 16 antisense) highlighting impact of PS stereochemistry in sense strand (bottom left) with SpSp configuration showing the highest mean activity independent of AS strand. All other configurations are shown with respect to activity of SpSp. Interaction between PS stereochemistry in 5'- and 3'-ends of the AS strand is shown (bottom right). See also Supplementary Table S1 and Supplementary Figure S1. (C) Ttr mRNA expression 1-week post 2 mg/kg dose. The same stereopure sense strand (shown) was used for all indicated stereopure antisense strands. Stereopure antisense strands are shown to the left of the graphs. TTR-2 is stereorandom reference format-1 and, NTC is stereorandom non-targeting control based on same format. Lines represent mean mRNA expression, and each point represents a different mouse. Stats: Welch's one-way ANOVA with Dunnett post hoc test with comparisons to TTR-2 * P < 0.05, ** P < 0.01, **** P < 0.0001. Right graph shows concentration of antisense strand detected in liver at same time point. Data are mean ± sem. Stats as described for mRNA graphic. (D) Serum Ttr protein expression after a single 6 mg/kg dose on day 0 for the same siRNAs shown in panel C. Data are presented as mean serum levels ± sem, n = 5 per group per time point. Stats: Linear mixed effects ANOVA with post-hoc test with comparisons to TTR-2 ** P < 0.01, **** P < 0.0001.

