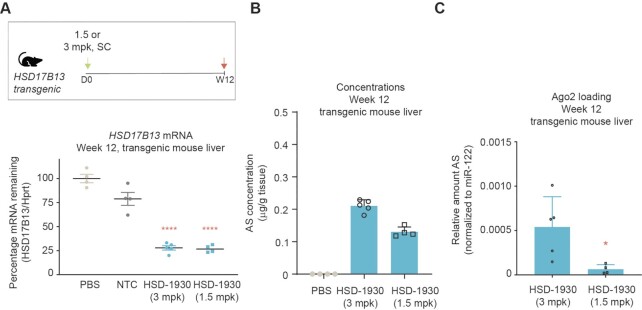
Figure 11.
HSD17B13 silencing with low, single dose. (A) Dosing regimen for transgenic HSD17B13 mice, with dosing at day 0 (D0) and tissue evaluation at the indicated time in weeks (W) post-dose. HSD17B13 mRNA levels in liver of transgenic mice treated with the indicated siRNA at 1.5 or 3.0 mg/kg 12-weeks post-dose. Data are presented as scatter plots with lines denoting mean mRNA levels, n ≥ 4. Stats: One-way ANOVA with post-hoc test comparison to PBS ****P < 0.0001. (B) Concentration of antisense strands in livers 12-weeks post-dose for the indicated treatment. Data are presented as mean ± sd, n ≥ 4. (C) Relative Ago2 loading for antisense strands in mouse livers over time with normalization to miR-122. Data are presented as mean ± sd, n = 5. Stats: Unpaired, two-tailed t test * P < 0.05.

