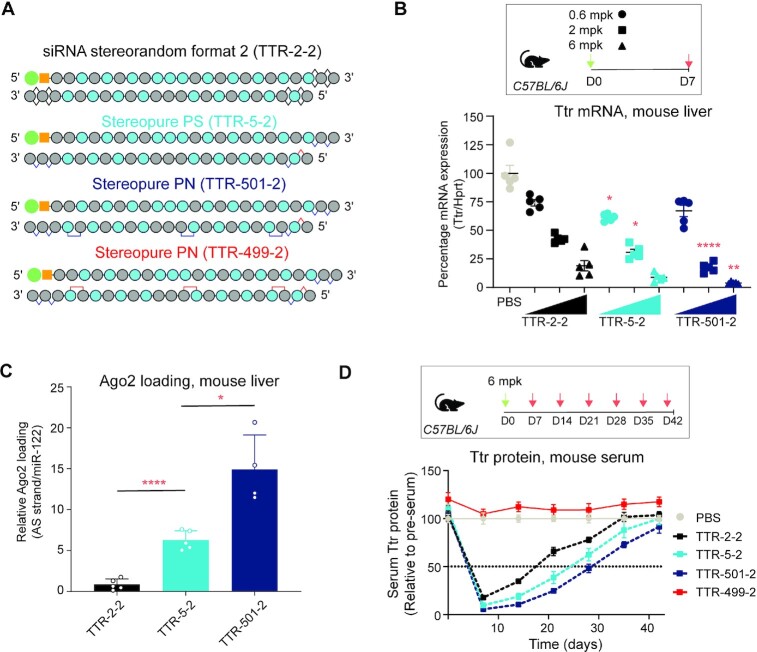
Figure 5.
Application of stereopure PN chemistry and interrogation of the sense strand in vivo. (A) Cartoons of siRNAs evaluated in panels B–D, which contain sense-2 strand configuration and the indicated antisense strands. (B) Percentage of Ttr liver mRNA expression in mice 1-week after treatment with the indicated siRNA. Dosing regimen is shown, with green arrow indicating time of treatment and red arrow indicating time of tissue collection. Horizontal bar is mean, and each dot represents a different mouse, n = 5 per group. Stats: Two-way ANOVA with post-hoc comparison to stereorandom siRNA at the same dose. * P < 0.05, ** P < 0.01, **** P < 0.0001. (C). Relative Ago2 loading of antisense strand (AS) standardized to miR-122 and normalized to TTR-2–2 in livers treated with 2 mg/kg siRNAs as illustrated in panel B. Data are presented as mean ± sd, n = 5 per group. Stats: Welch's one-way ANOVA with post-hoc comparisons * P < 0.05, **** P < 0.0001. (D) Percentage Ttr serum protein in mice over time after treatment with 6 mg/kg of the indicated siRNA. Dosing regimen is shown, with green arrow indicating time of treatment and red arrow indicating time of serum collection. A pre-dose serum sample was also taken for each animal. Data are presented as mean ± sd, n = 5 per group. Stats: linear mixed effects ANOVA with post-hoc tests.

