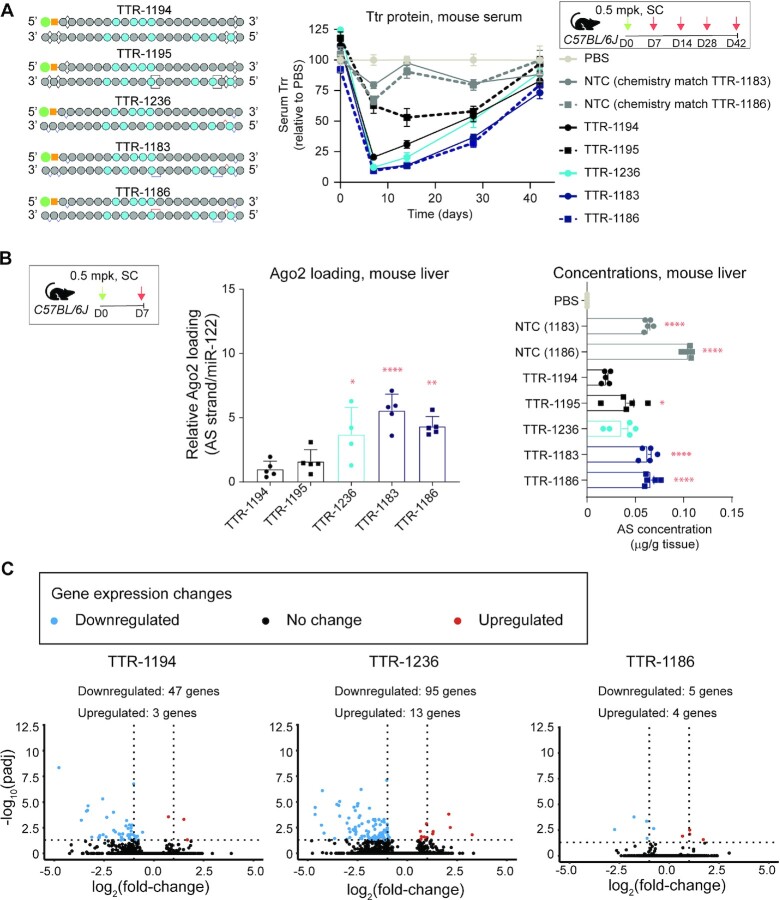
Figure 8.
Optimized siRNA format 3 shows improved silencing activity. (A) Schematic representation of siRNAs tested in the study (left). Dosing regimen and Ttr serum protein levels in mice treated with 0.5 mg/kg of the indicated siRNA. Serum Ttr levels (compared to PBS) over time for the indicated siRNAs. Data are presented as mean ± sd, n = 5 per group per time point. (B) Antisense strand Ago2 loading standardized to miR-122 and normalized to TTR-1194 for the indicated oligonucleotide at 1-week post-dose (left). Concentration of antisense strand in liver 1-week post-dose. Data are presented as mean ± sem. Stats: One-way ANOVA with post-hoc test comparisons to TTR-1194. P < 0.05, ** P < 0.01, *** P < 0.001, **** P < 0.0001. (C) Gene expression changes detected based on RNA-seq analysis of primary mouse hepatocytes treated with 2 μM of the indicated siRNA compared with PBS. Log2 fold-change in expression is plotted with respect to the P value. Dotted lines indicate statistical significance: the horizontal line denotes P = 0.01, and the vertical lines denote >1-fold-change in expression, with decreased expression to the left and increased expression to the right.

