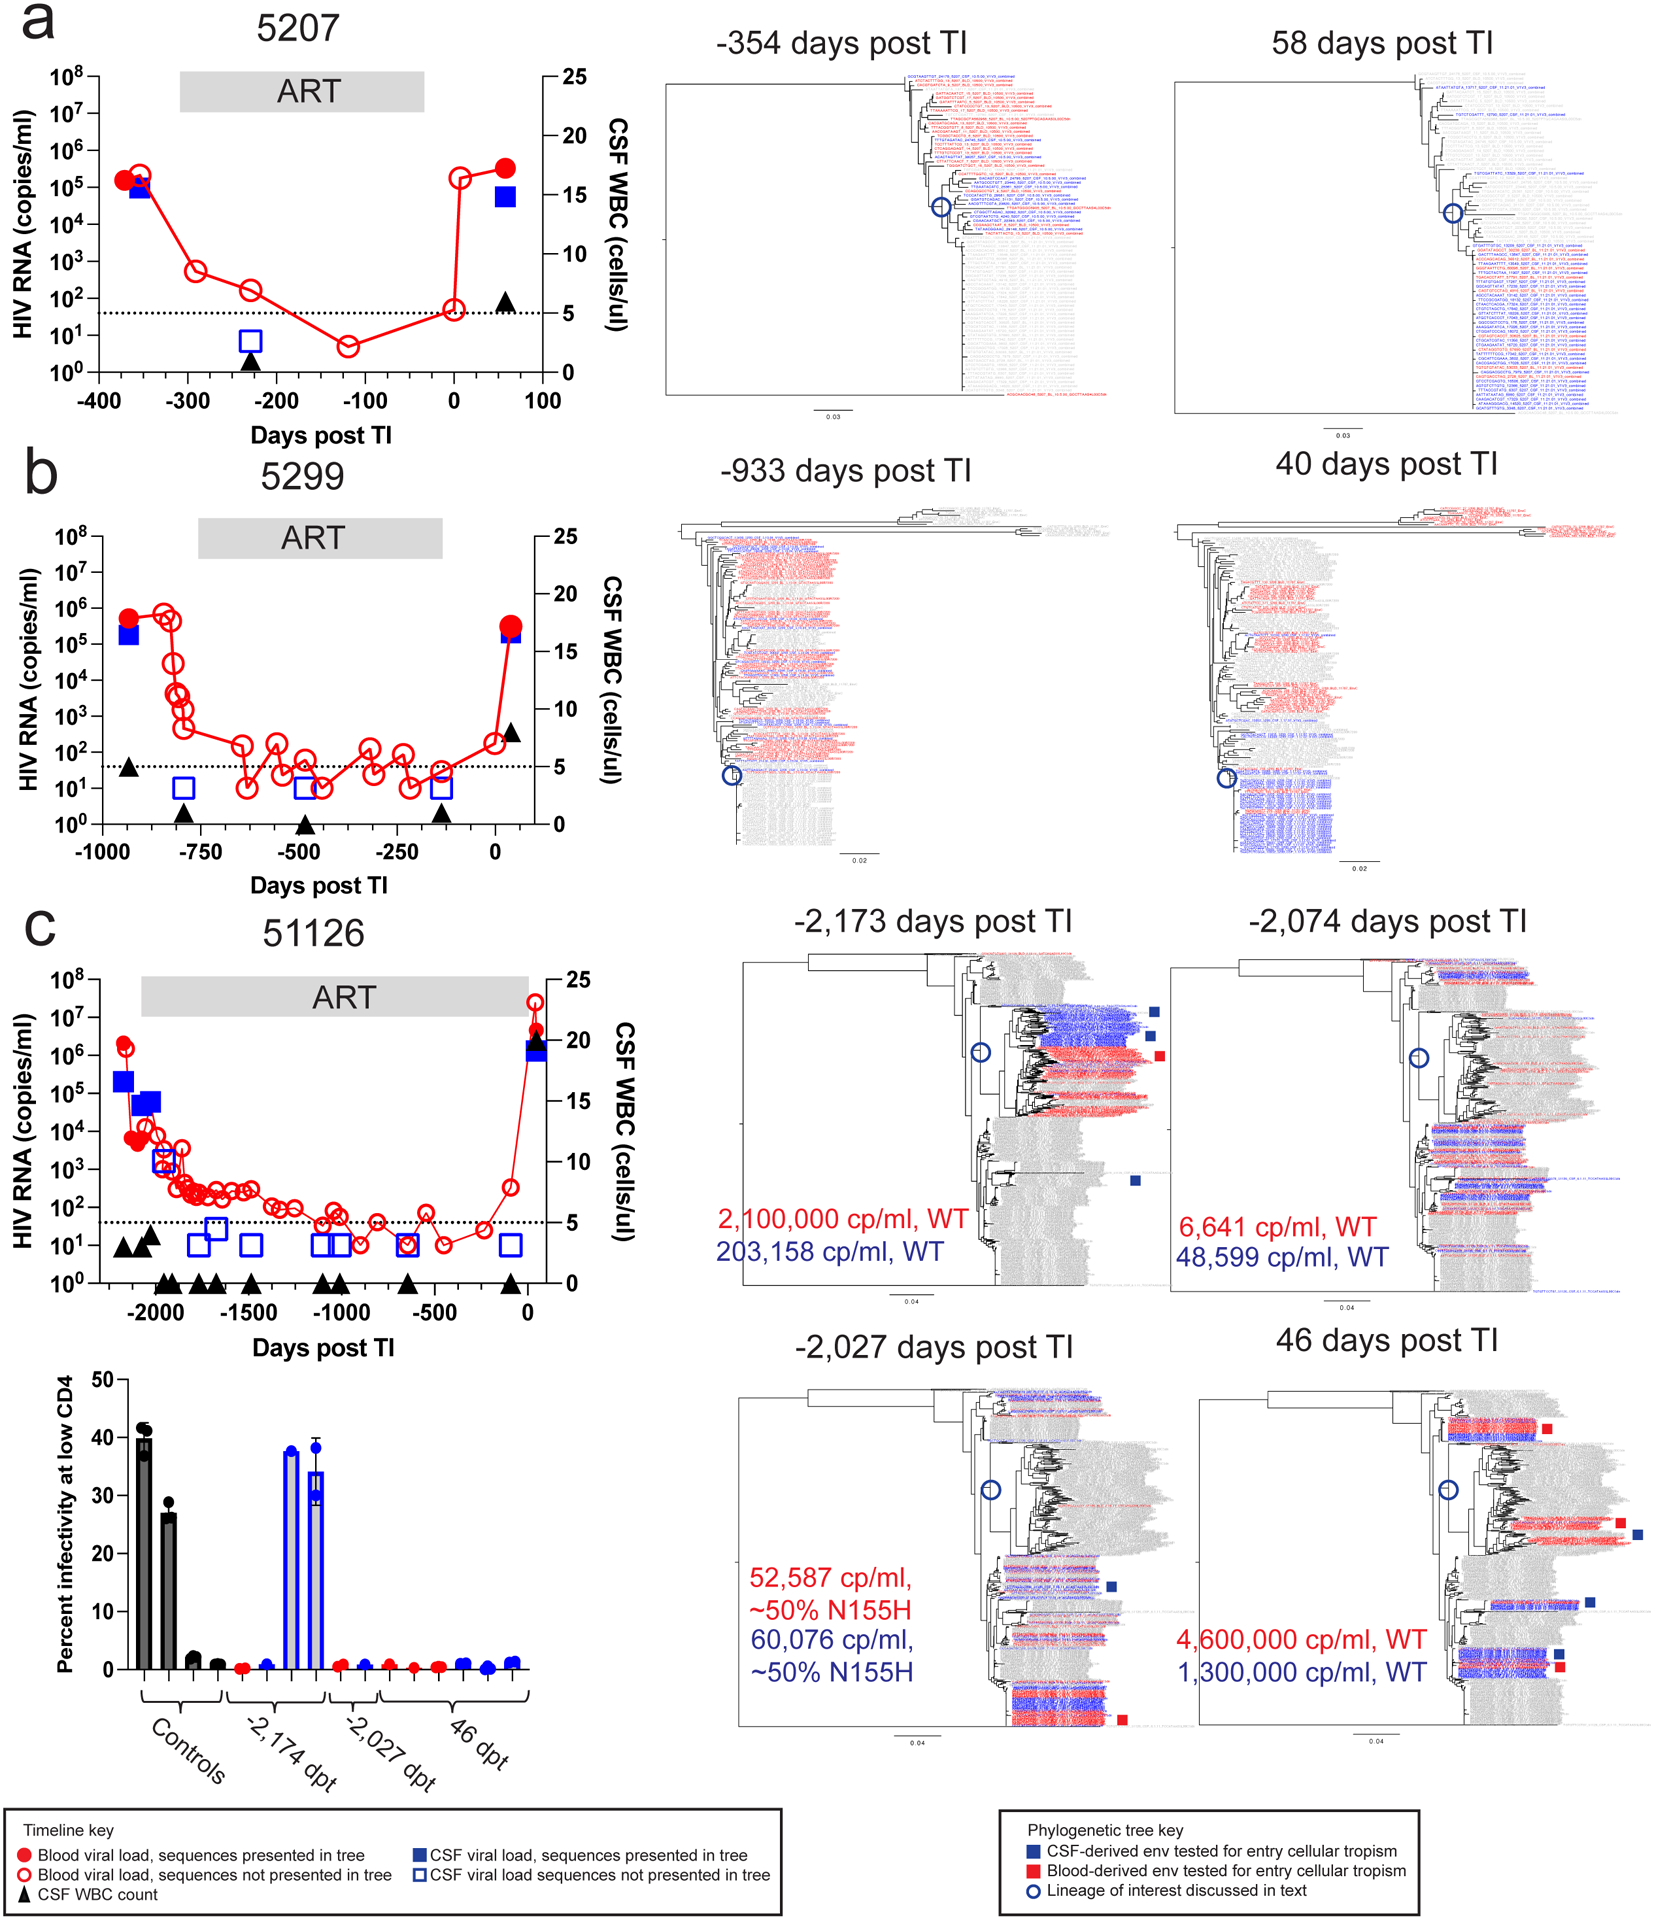
Figure 3. HIV-1 rebound populations compared to pre-therapy viruses.

Timelines and phylogenetic trees are shown for 3 participants: 5207 (a), 5299 (b), and 51126 (c). The first panel depicts viral loads in the plasma (red circles) and the CSF (blue squares) as well as the CSF WBC count (black triangles) before ART, during ART, and after TI. Time points prior to TI are shown as negative days. Neighbor-joining phylogenetic trees were constructed using up to 50 V1-V3 sequences (or all that were available if less) generated by Primer ID MiSeq deep sequencing at the indicated for each participant. Sequences from the plasma (in red) and CSF (in blue) from each specific time point are colored while the sequences the from other time points are gray. Full length env amplicons were generated from blood and CSF lineages for 51126 and their shorter sequence equivalents are shown in the deep sequencing trees as red and blue squares, respectively. In these trees we have limited the number of sequences used to ensure there are similar numbers for the two compartments or to make the trees more visually accessible, with the number of sequences used provided in Extended Data Table 1. In order to validate this approach, we also examined trees for the same participants that included all available sequences and still observed that the CSF was often dominated by clonally amplified sequences and inclusion of more sequences did not provide additional information. The full length amplicons were tested for entry phenotype in the Affinofile assay with the results shown in the lower left panel with the clones grouped by day post TI of the sample. Positive and negative controls for the M-tropic entry phenotype were included and shown in black, while clones generated from CSF are shown in blue and from blood in red. 3 technical replicates were done for each clone and 1–3 replicate clones were tested for each env. Specific numbers of clones tested for each env are as follows from left to right: 2 clones, 1 clone, 1 clone, 2 clones, 2 clones, 1 clone, 1 clone, 1 clone, 3 clones, 2 clones, 3 clones, 2 clones. The infectivity at low CD4 values for each replicate clone are shown with the dots on the bar graph and the mean and standard deviation values for the replicates are shown with the bar and error bars, respectively.
