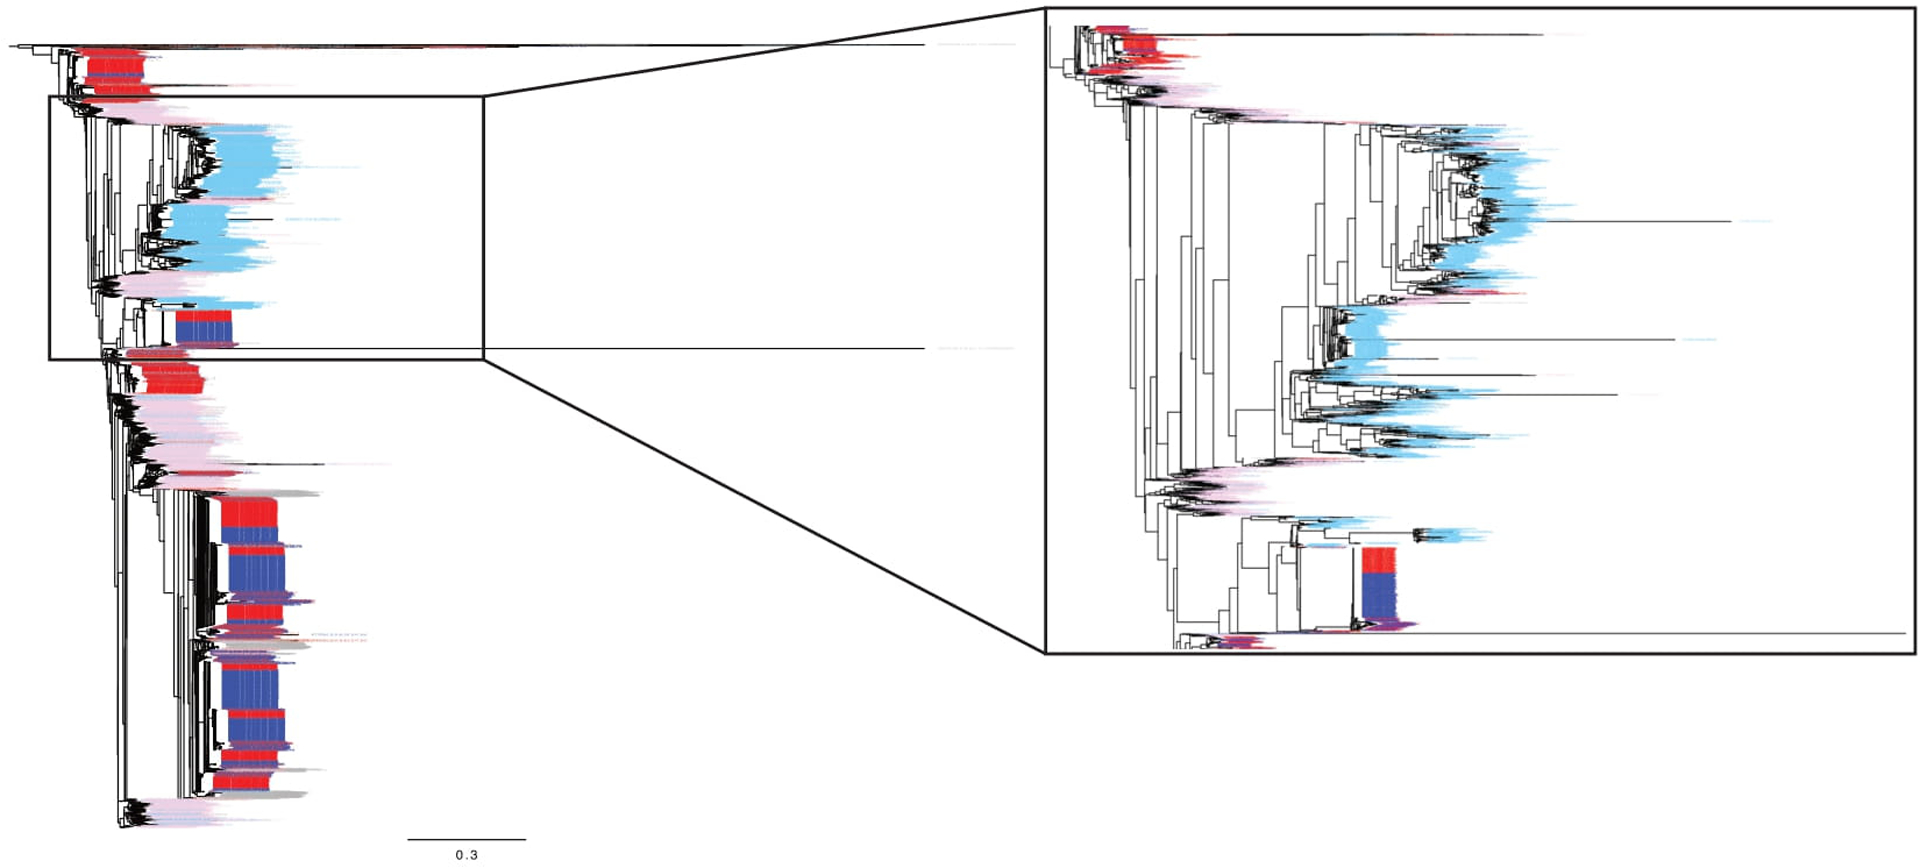
Extended Data Figure 2. Deep sequencing of HIV-1 populations from participant 51126.

Neighbor-joining phylogenetic tree containing a large sampling of template consensus sequences (TCS) from MiSeq/Primer ID sequencing from the pretherapy and TI time points. Sequences from the blood plasma pretherapy are shown in pink (1,734 TCS). Sequences from the CSF pretherapy are shown in light blue (1,734 TCS). Sequences from the blood plasma post TI are shown in red (2,233 TCS). Sequences from the CSF post TI are shown in dark blue (2,233 TCS). Also included in gray are 50 sequences from the blood and CSF from each of the two intermediate decay time points. On the right the tree is expanded to show the portion where the macrophage-tropic virus lineage was found in the CSF pretherapy.
