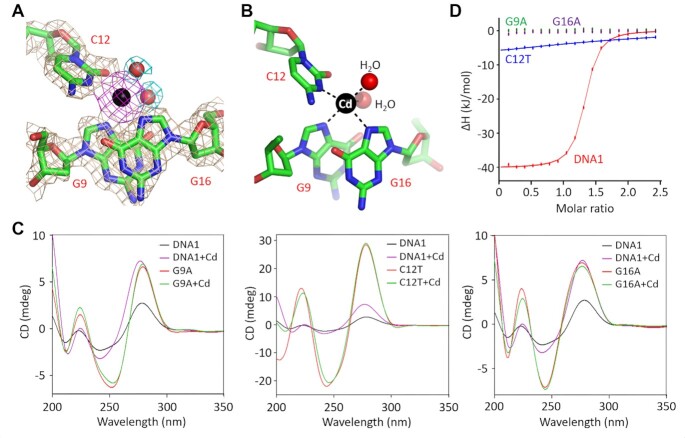
Figure 2.
Coordination of Cd2+ by the CBL-loop. (A) The 2Fo–Fc electron density maps (contour level, 1.5σ) of Cd2+ and the coordinating nucleotides. (B) The detailed coordination of the Cd2+. (C) Comparison of the CD spectra of the native DNA1 and the G9A, C12T and G16A variants. (D) Comparison of Cd2+ binding by the native DNA1 and the G9A, C12T and G16A variants by ITC assays. In panels (A) and (B), Cd2+ ion and the Cd2+-coordinating water molecules are shown as spheres in black and red, respectively.

