Figure 4.
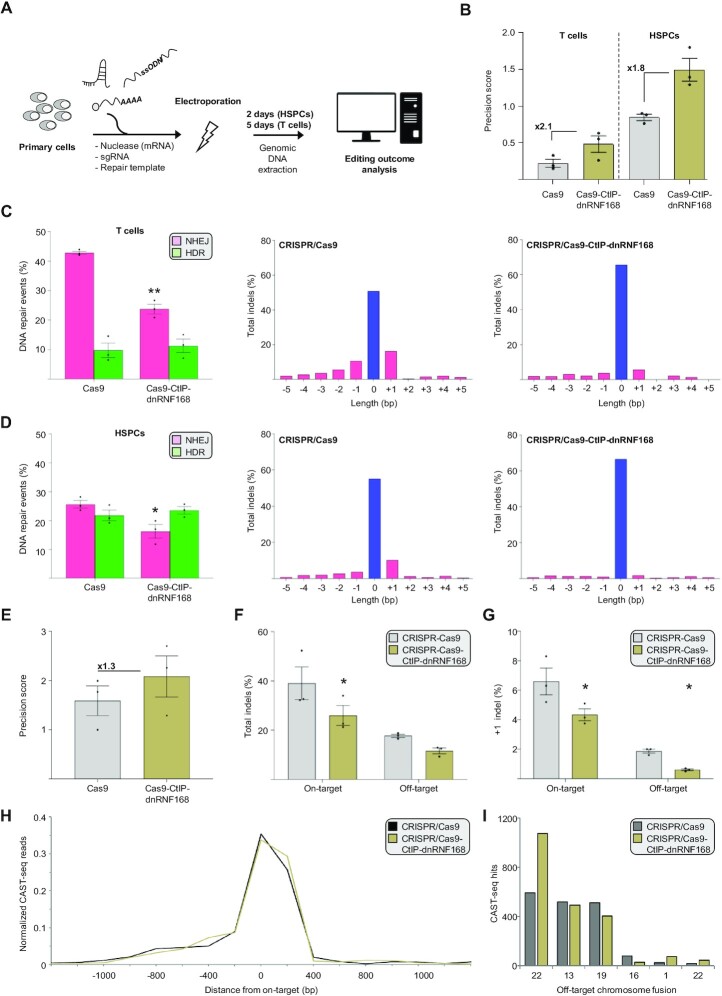
CRISPR/Cas9-CtIP-dnRNF168 stimulates precise genome editing in primary human hematopoietic cells using an ssODN repair template. (A) Experimental design. Genome editing components are electroporated in primary human hematopoietic stem and progenitor cells (HSPC) or T lymphocytes and the extent of precision editing is measured via TIDER or next generation sequencing two and five days later, respectively. (B) The graph shows the precision score of the indicated nuclease targeted to CCR5 site #2, computed as the ratio between the HDR and NHEJ events measured via TIDER, either in primary human T cells (left) or stem and progenitor cells (right). Fold change, as compared to the unmodified Cas9 nuclease, are reported within the graphs. (C, D) The bar graphs indicate the frequency of NHEJ- or HDR-mediated DSB resolution (left panels) and the nature of the different indel mutation identified (right panels) via TIDER. The extent of unmodified sequence is indicated in blue. (E) The diagram shows the precision score measured via next generation sequencing and calculated as in panel B for the indicated nucleases targeted to CCR5 site #1. Fold change, as compared to the unmodified Cas9 nuclease, are reported within the graph. (F) Extent of indel formation at the CCR5 site #1 target site (On-target) and at a previously identified off target site (Off-target) in the CENPJ gene, using the indicated nucleases. (G) Frequency of the +1 indel measured at the on- and off-target sites indicated in panel F. (H) The graph shows the chromosomal aberrations identified within a window of 2.4 kb surrounding the CCR5 site #1 target site (on-target) via CAST-seq. The normalized read count is indicated. (I) Bar graph displays normalized CAST-seq reads that indicate the number of translocations between the on-target site and an off-target site on the indicated chromosomes. In panels B–G, each dot represents a biological replicate. Statistically significant differences, as compared to the unmodified Cas9 nuclease, are indicated with asterisks and correspond to p-values calculated with a two-tailed, paired Student's t-test (*P< 0.05, **P< 0.01). Error bars indicate SEM.

