Figure 1.
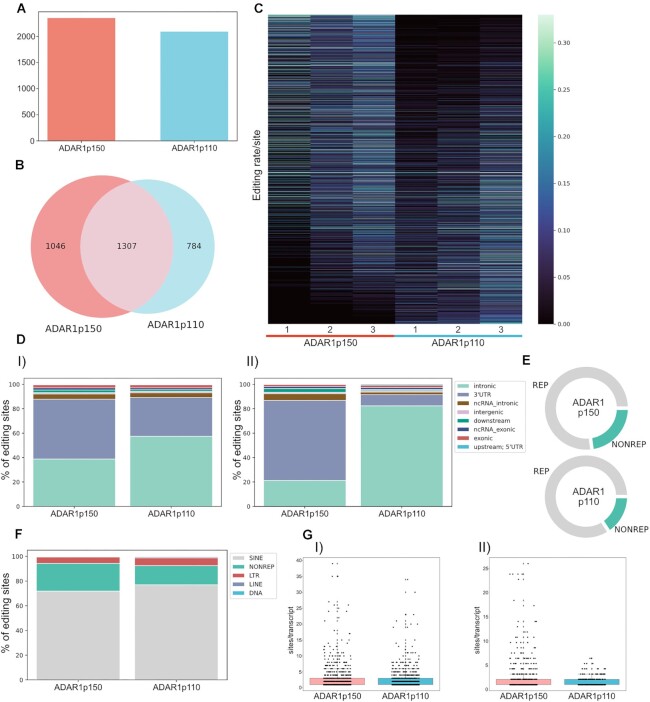
ADAR1p150 and ADAR1p110 display isoform-specific editing patterns. (A) 2353 editing sites are efficiently edited (≥1% editing ratio) by ADAR1p150, and 2091 sites are efficiently edited by ADAR1p110. (B) Of the detected sites ≈ 42% are efficiently edited by both isoforms (1307); 33% are preferentially edited by ADAR1p150 (1046), and nearly 25% are preferentially edited by ADAR1p110 (784). (C) Heat map showing editing ratio of detected editing sites. Despite the large overlap of editing sites between ADAR1-isoforms, the majority of sites still shows a clear preference for one or another isoform. The sites were sorted based on log2-fold difference in editing ratio (p110/p150 in ascending order, showing the sites preferentially edited by ADAR1p150 on the top and sites edited by ADAR1p110 on the bottom of the heatmap. (D) Gene-region distribution of editing sites for ADAR1-isoforms. (I) Distribution of all efficiently edited sites. ADAR1p110 edits prevalently in introns. Apart from the intronic regions, ADAR1p150 efficiently edits a prominent portion of 3'UTRs. (II) Distribution of editing sites that are preferentially edited by one isoform over the other (sites with log2FD ≥ 1 for ADAR1p110 and sites with log2FD ≤ –1 for ADAR1p150). Editing sites edited by ADAR1p110 are almost exclusively intronic, whereas a major portion of ADAR1p150 specific sites locates to 3'UTRs. (E) ADAR1p150 edits more nonrepetitive regions (∼23%) than ADAR1p110 (∼16%). (F) The majority of editing is located within SINE elements. G) ADAR1p150 edits more hyperedited regions. I) Boxplot of all detected sites; II) Boxplot of sites preferentially edited by one isoform (sites with log2FD ≥ 1 for ADAR1p110 and sites with log2FD ≤ –1 for ADAR1p150). Box depicts range from the 25th to 75th percentile. Whiskers depict 1.5× interquartile range from top/bottom of box. Black dots mark number of editing events per transcript. Grey dots depict outliers.

