Figure 3.
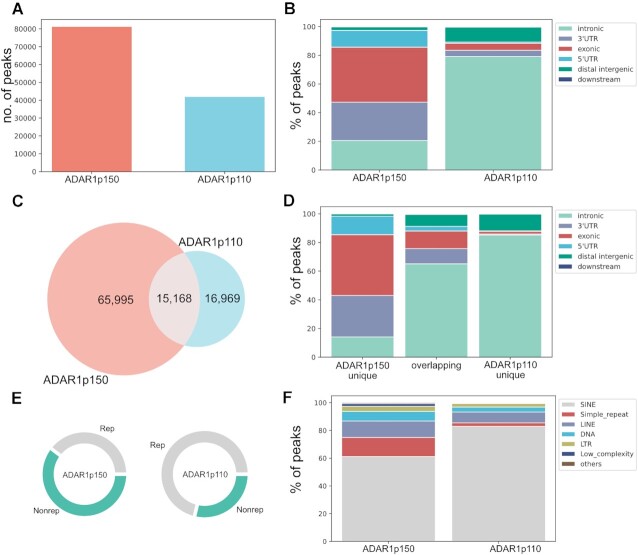
RIP-seq identifies distinct binding regions for ADAR1-isoforms. (A) Number of peaks identified by peak-caller after passing filtering criteria. ADAR1p150: 81.163, ADAR1p110: 41.900. (B) Peak-distribution in gene regions. ADAR1p110 mainly binds in introns whereas ADAR1p150 shows more complex binding involving exons and 3'UTRs. (C) Isoform-specific and overlapping peaks (depicted ADAR1p150 overlap – 15.168 overlapping peaks). (D) Distribution of isoform-specific and overlapping peaks to gene regions. (E) Peak distribution to repeats and non-repetitive regions. While only 29% of ADAR1p110-peaks cover unique regions >60% of ADAR1p150-peaks span non-repetitive regions. (F) The majority of interacting repeats locates to SINE elements, especially in the case of ADAR1p110. ADAR1p150 binds more diverse repeats, including also simple repeats, LINE and DNA transposons.

