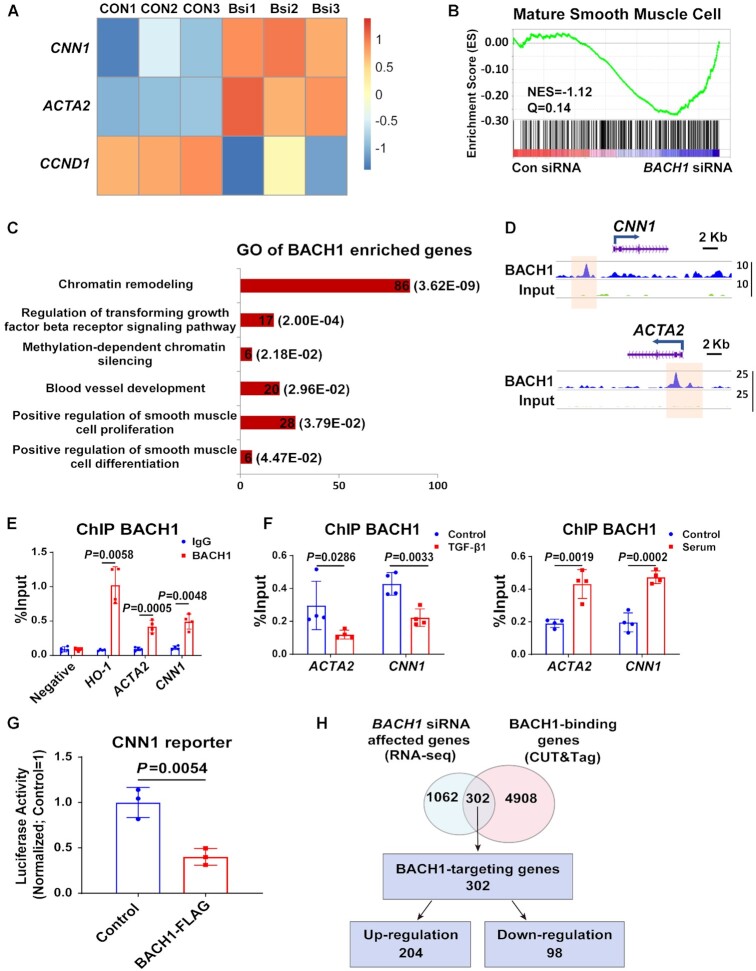
Figure 5.
BACH1 binds at the VSMC marker genes’ promoter and inhibits their expression. (A) Heatmap showed that ACTA2 and CNN1 were upregulated and CCND1 was down-regulated in BACH1 silencing HASMCs compared with the control HASMCs by RNA-seq analysis. (B) Gene Set Enrichment Analysis (GSEA) of differentially expressed genes between BACH1 silencing HASMCs and the control HASMCs among genes associated with mature smooth muscle cell (NES = −1.12, Q =0.14). (C) The Gene Ontology analysis of BACH1 enriched genes. (D) Representative snapshots of CUT&Tag tracks for BACH1 on the promoter of ACTA2 and CNN1. (E) ChIP-qPCR analysis validated the enrichment of BACH1 at the promoter of ACTA2 and CNN1, HO-1 was used as a positive control (n = 4 independent experiments, data are mean ± SD. unpaired two-tail t-test). (F) ChIP-qPCR analysis validated the increased enrichment of BACH1 under serum stimulation and the decreased enrichment of BACH1 under TGF-β1 stimulation on BACH1-targeting genes’ promoter (n = 4 independent experiments, data are mean ± SD. unpaired two-tail t-test). (G) The CNN1 luciferase reporter or a pGL3-basic luciferase reporter was co-transfected with the control vector or BACH1-Flag into HASMCs and luciferase activity was evaluated 24 h later (n = 3 independent experiments, data are mean ± SD. unpaired two-tail t-test). (H) Venn diagram showed the corresponding numbers of BACH1-binding genes analyzed by CUT&Tag, and genes whose expression was affected by BACH1 knockdown analyzed by RNA-seq.

