Figure 3.
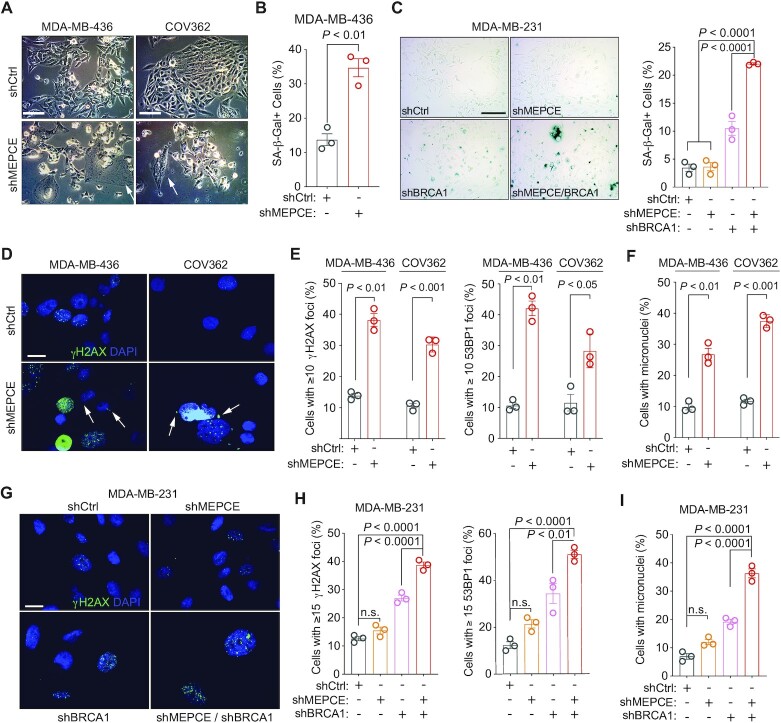
Loss of MEPCE in BRCA1-deficient cells increases genomic instability and induces senescence. (A) Representative images of indicated cells. Arrows indicate large and flat senescent cells. Bar = 50 μm. (B) Quantification of SA-β-gal activity in indicated cells. (C) Representative images and quantification of SA-β-gal activity in indicated cells. Bar = 100 μm. (D) Representative images of γH2AX and DAPI staining in indicated BRCA1-mutant cells. Arrows indicate micronuclei. (Bar = 25 μm). (E) γH2AX and 53BP1 foci quantification in indicated cells. (F) Quantification of micronuclei-positive cells in indicated cell type. (G) Representative images of γH2AX and DAPI staining in indicated cells (bar = 25 μm). (H) γH2AX and 53BP1 foci quantification in indicated cells. (I) Quantification of micronuclei-positive cells in indicated cell type. Each dot represents a replicate. Mean ± SEM is shown for all figures. For B, E and F, statistical significance was calculated using Student's t-test. For C, H and I, statistical significance was calculated using one-way ANOVA (Tukey's multiple comparisons test).

