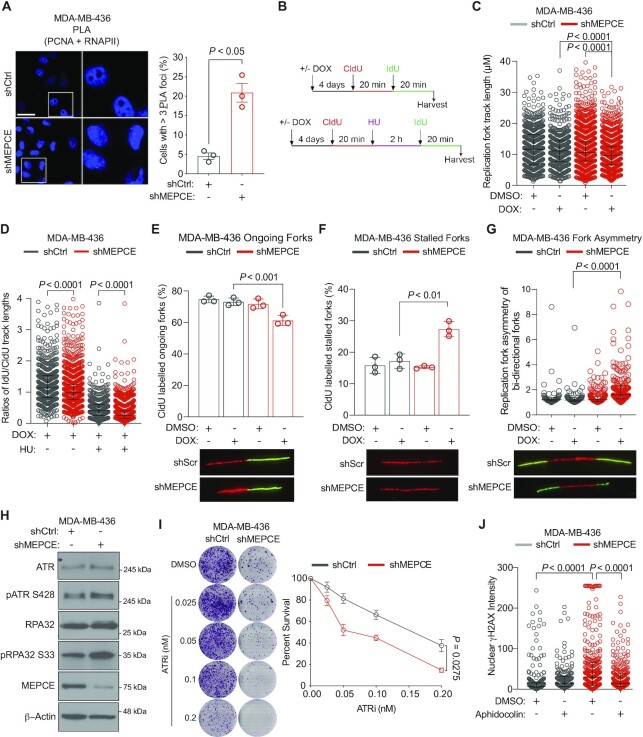
Figure 6.
MEPCE deficiency leads to transcription-replication collisions and replication stress in BRCA1-deficient cells. (A) Representative images and quantification of cells with ≥3 PLA foci per nucleus. Bar = 20 μm. More than 100 cells were quantified per biological replication. Three biological replicates were performed. (B) Schematic of conditions for DNA fibre experiments in figures C–G. (C) Quantification of fork track length in indicated cells. (D) Quantification of the fork rate in indicated cells. (E, F) Quantification of the percentage of ongoing forks (E), and stalled forks (F) in indicated cells. (G) Quantification of fork asymmetry. (H) Western blot indicating the expression and phosphorylation levels of the replication stress proteins ATR and RPA32. (I) Representative images and graph of 21-day clonogenic survival of indicated cells treated with DMSO or the ATRi Berzosertib. (mean ± SEM). (J) Nuclear γH2AX quantification in indicated cells treated with vehicle control or 250 nM aphidicolin for 2 h. Median with interquartile range is shown; >100 nuclei were scored per condition. For A, E and F, mean ± SEM is shown. For C and D, median with interquartile range is shown; Kruskal–Wallis test. E and F, multiple Student's t-test. G, Mann–Whitney Rank Sum test. I, two-way ANOVA (Sidak's multiple comparisons test). J, one-way ANOVA (Tukey's multiple comparisons test).

