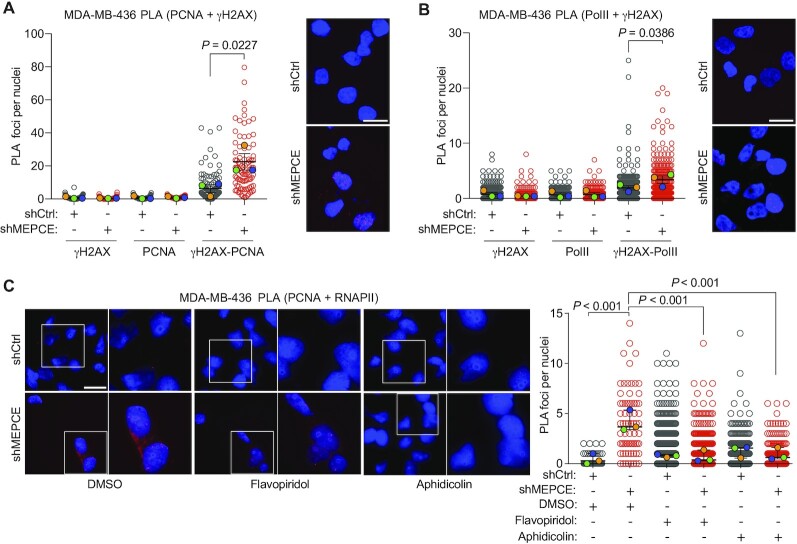
Figure 7.
MEPCE deficiency in BRCA1-mutant cells leads to an increase in transcription-replication conflicts. (A) Representative images and quantification of PCNA-γH2AX PLA foci per nucleus in the indicated cells (mean ± SEM). Quantification for single antibody controls are shown. Bar = 15 μm (n = 3). (B) Representative images and quantification of PolII-γH2AX PLA foci per nucleus in the indicated cells (mean ± SEM). Quantification for single antibody controls are shown. Bar = 15 μm (n = 3). (C) Representative images and quantification of PLA foci per nucleus in the indicated cells (mean ± SEM) treated for 1 h with vehicle control DMSO or aphidicolin (250 nM) or flavopiridol (2 μM). Bar = 20 μm (n = 3). For A–C, statistical significance was calculated using one-way ANOVA (Tukey's multiple comparisons test).

