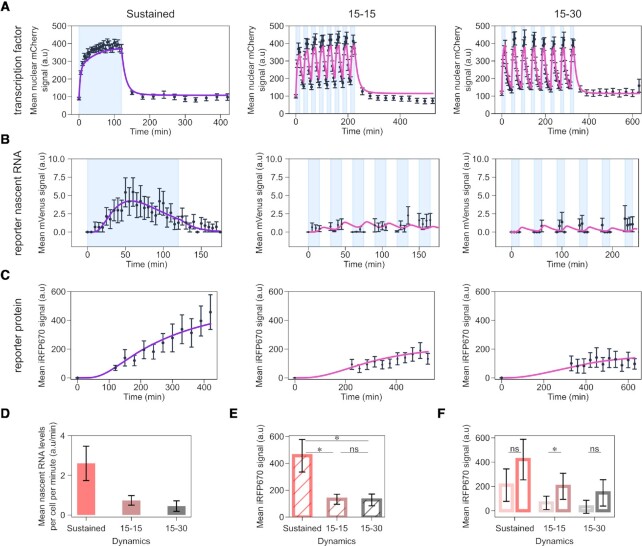
Figure 3.
A promoter with weak RE and TATA box distinguishes TF dynamics. (A-C) Quantification of synTF nuclear translocation (A), mean reporter nascent RNA (B) and protein (C) levels over time for the indicated TF dynamics. Light blue shadowing, blue light illumination phase. Together with the experimental data (black dots), fitted (violet line; for sustained dynamics) and simulated (pink line; for both pulsatile dynamics) values are shown. The mathematical model used is shown in Figure 4 and the equations are described in the Supplememtary Text. (D) Quantification of mean nascent RNA per cell per minute for the indicated synTF dynamics. (E) Quantification of mean reporter protein expression levels at the end of the experiment for the indicated synTF dynamics. (F) Quantification of mean reporter protein expression levels at the end of the experiment for high (dark colors) or low (light colors) synTF amplitudes for the indicated synTF dynamics. (E, F) P-values were calculated with the Welch's t-test. ns, non signficant (P > 0.05). (E) *, P-value (from left to right) = 0.0217; 0.0212. (F) *P-value = 0.03292. (A–F) Data represent mean ± s.e.m. of at least n = 20 individual cells, imaged on at least n = 3 biologically independent experiments. The promoter used in these experiments was p4.

