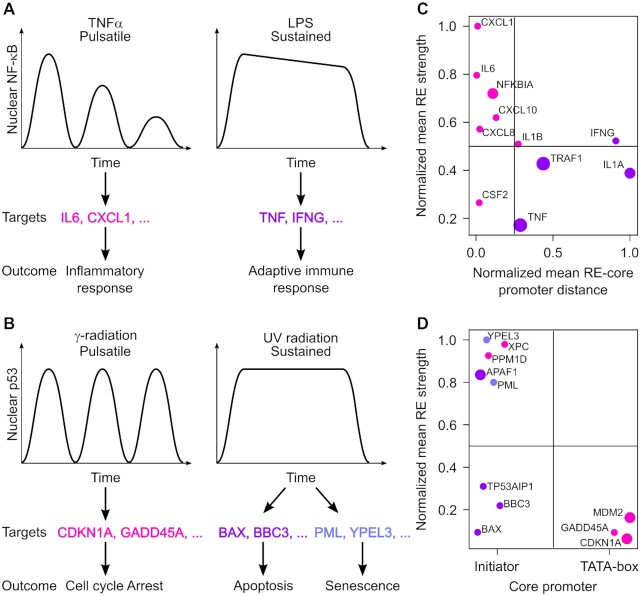
Figure 7.
Promoter features allow the classification of NF-κB- and p53-responsive promoters into sensitive and insensitive to dynamics. (A, B) Schematic representation of how different NF-κB (A) and p53 (B) dynamics lead to the expression of different target genes. (C, D) Plot showing NF-κB-responsive promoters according to the mean distance between the REs and the core promoter (TATA box for all promoters except TRAF1, for which the Inr was considered) normalized to the longest distance (x-axis) and the mean RE strength normalized to the strongest RE (y-axis) (C) and p53-responsive promoters according to the type of core promoter (x-axis) and the mean RE strength normalized to the strongest RE (y-axis) (D). Each dot represents a promoter, color-coded to indicate activation by pulsaltile (magenta) or sustained (violet) TF signal, as in (A). The size of the dots increases with the number of REs.

