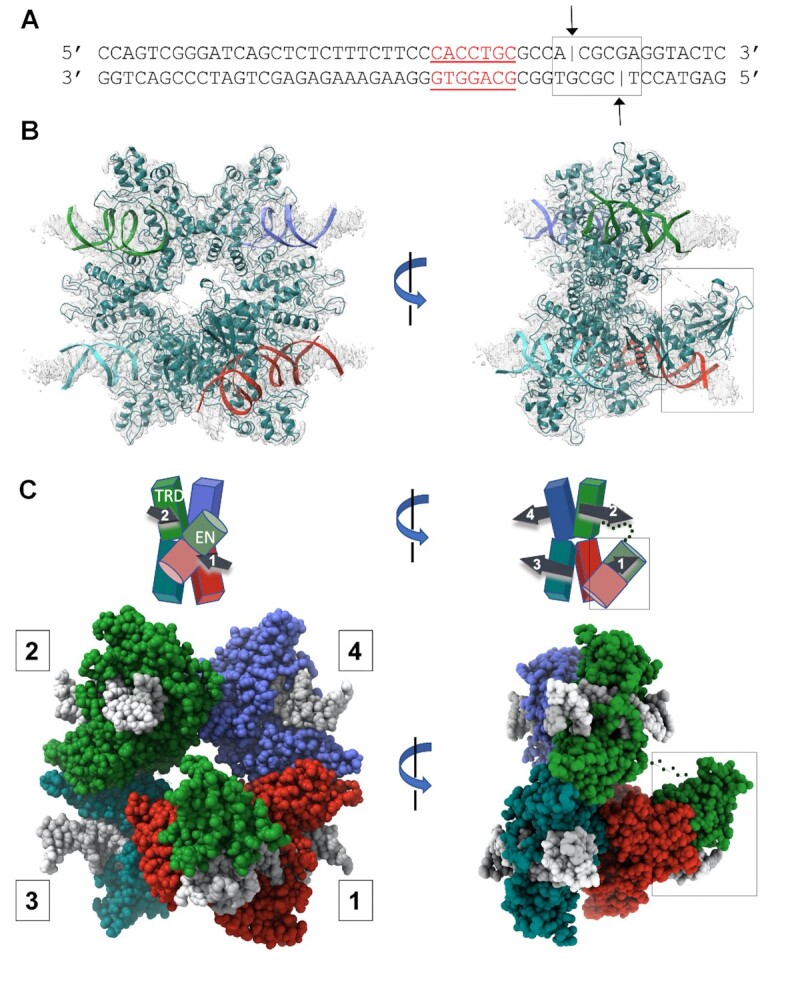
Figure 4.

CryoEM analysis of DNA-bound PaqCI. (A) Sequence and basepair arrangement of DNA duplexes used to form a DNA-bound enzyme complex. The duplex consists of 50 complementary basepairs and includes both the enzyme's 7 bp target site (red underlined bases) and its downstream cleavage sites on the top and bottom strands (black lines and arrows, 4 and 8 bp downstream from the final basepair of the target site). (B) CryoEM electron density corresponding to the DNA-bound PaqCI enzyme. Each of the four double-stranded DNA oligoduplex is independently colored to match that of its bound monomer shown in Panel C. The protein tetramer is colored in teal. The right image is rotated 90° around the y-axis and the endonuclease (EN) domains engaged for cleavage are boxed. (C) Cartoon representation and space filling model of DNA-bound enzyme structure and domain organization. The target recognition domains (TRDs) are represented by rectangles and the EN domains are shown as cylinders. DNA duplexes and their directionality (5’ to 3’) are denoted with black arrows in the cartoon. Each TRD is engaged with one DNA duplex, via contacts to bases and neighboring backbone atoms distributed across the target site. The downstream region of each bound DNA, including the sites of cleavage, extend away from the TRD tetramer. The DNA duplexes engaged to each protein dimer (DNA 1 and 2 on one side of the complex, and DNA 3 and 4 on the opposite side of the complex) are roughly parallel to one another, as indicated in the cartoon schematics. All four ENs have been released from their positions in the DNA-free apo-enzyme structure. Two ENs (from TRDs colored blue and teal bound to DNA 3 and 4) are disordered and are unobservable in the density map. The other two ENs (from TRDs colored red and green, cis and trans, bound to DNA 1 and 2) are observed to have undergone significant motions resulting in their engagement around the cleavage site on one bound DNA duplex. The two EN domains engaged for cleavage are boxed. Size exclusion chromatography traces of DNA-bound complexes, representative negative stain EM class averaged images, and electron density surrounding the DNA cleavage site complexes are further illustrated in Supplementary Figure S3.
