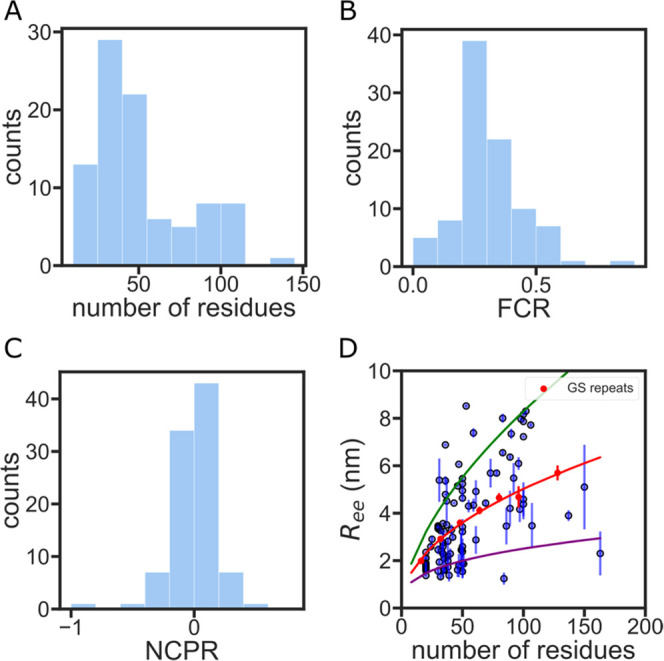
Figure 3.

IDR simulation database shows diverse sequence properties and structural preferences. (A) Sequence length distribution of the IDR simulation database. (B) Fraction of charged residue (FCR) distribution of the IDR simulation database. (C) Net charge per residue (NCPR) distribution of the IDR simulation database. (D) End-to-end distance vs the number of residues for each simulated IDR. Error bars are calculated from five independent simulations of the same sequence. GS repeat simulations are shown in red. The red curve is a power law fit of the GS repeat data (see also Figure S1). The green and purple curves represent the Ree of a polymer with the same prefactor as GS repeats but a scaling exponent of 0.59 (extended homopolymer) and 0.33 (compact homopolymer), respectively.36
