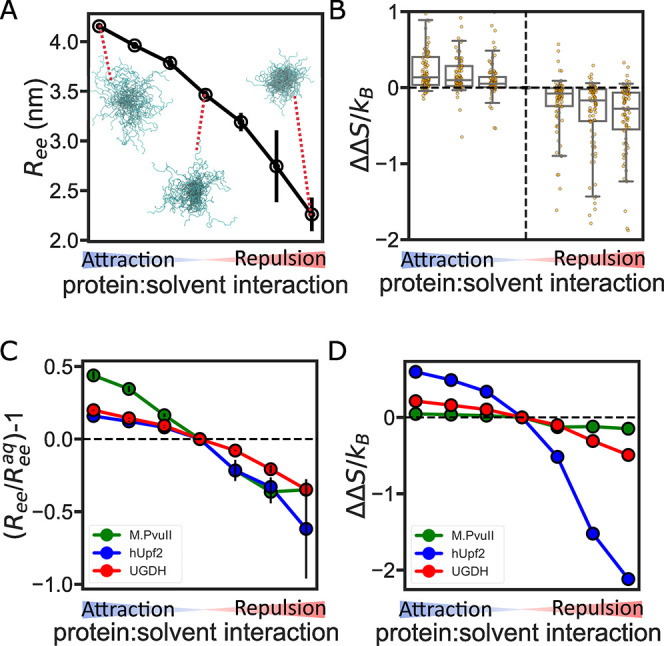
Figure 6.

Solution conditions alter IDR entropic force. (A) End-to-end distance for UGDH-fl as a function of backbone:solution interactions. The blow-up ensembles show representative conformations in attractive, neutral (aqueous), and repulsive solutions. (B) Box plot showing the change in entropic force due to change in protein backbone:solvent interactions. Boxes show the median as a central line, the median 50% as the box limits, and the median 90% of the data as the whiskers. Individual sequences are shown as points overlaid on each box. (C) Solution sensitivity of three IDR ensembles. Solution sensitivity is quantified using relative Ree compared to the Ree of the same IDR in the neutral (aqueous) solution. (D) Change in entropic force due to solution condition changes for the three IDR ensembles.
