FIGURE 2.
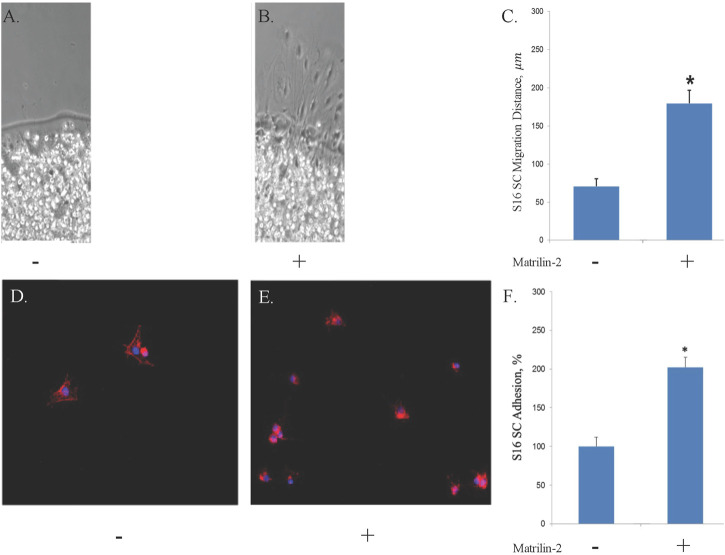
A-C, S16 SC agarose drop migration assay visualized by phase-contrast microscopy. Tissue glass coverslips coated with (A) ribonuclease-free water or (B) matrilin-2. Scale bar: 20 μm. (C) Quantification of migration distances noting significantly increased migration atop matrilin-2 compared to water. * denotes statistical significance of p < 0.0001. D-F, Fluorescent microscopy of Schwann cell adherence on tissue glass covered with (D) ribonuclease-free water and (E) matrilin-2. (F) Fluorescent profile denoting cellular presence was measured with Matrilin-2 compared against water noting a significantly greater presence of fluorescence and cellular adherence with matrilin-2. * denotes statistical significance of p < 0.01.

