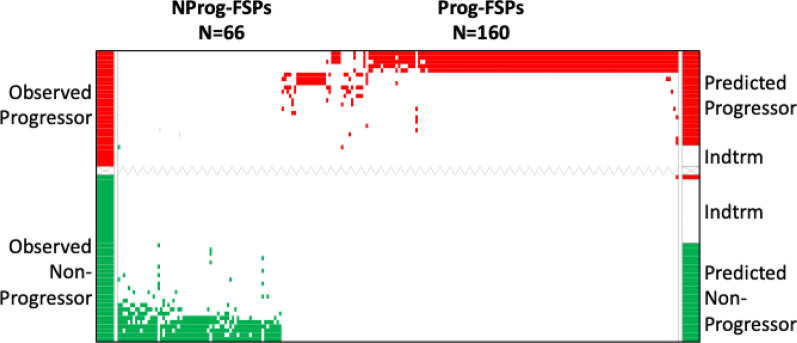
Fig. 1.
The ordered-scores map displays performance of the predictive model for disease progression compared to observed outcomes. Both observed and predicted non-progressor samples and FSPs are shown in green; observed and predicted progressor samples and FSPs are shown in red; indeterminate samples are in white. FSPs are represented on the X-axis; predicted outcomes of patients are shown on the right Y-axis; observed outcomes of patient are represented on the left Y-axes. NProg-FSPS non-progressor associated FSPs; Prog-FSPs progressor associated FSPs; Indtrm Indeterminate

