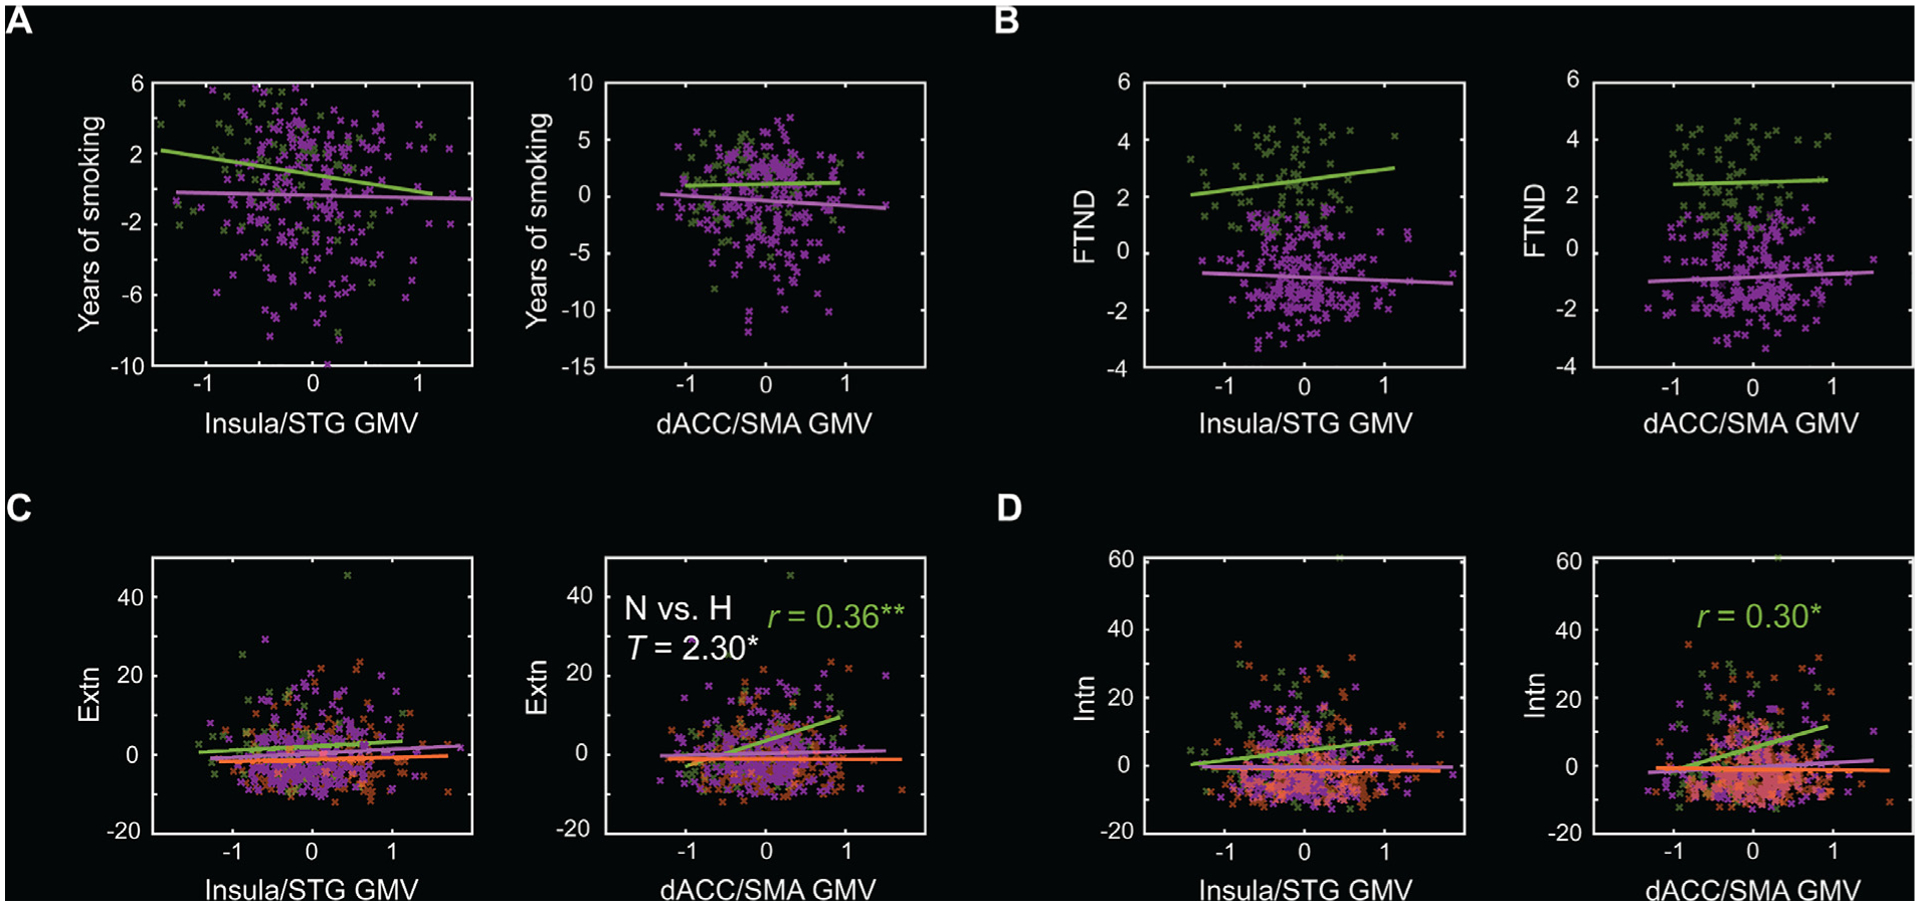
Fig. 2.

Scatter plots to show the correlations of insula/STG GMV and dACC/SMA GMV with (A) years of smoking, (B) FTND score, (C) externalizing (Extn), and (D) internalizing (Intn) score, with age, sex, average daily number of drinks, years of education, and TIV as covariates for the three groups separately. There were no data of years of smoking or FTND scores for never smokers. Residuals are presented here. Solid lines represent the regressions. Heavy (H) smokers: green; Light smokers: purple; Never (N) smokers: orange. Significant r and slope test T values are marked with * * p < 0.005, or * p < 0.05 (two-tailed).
