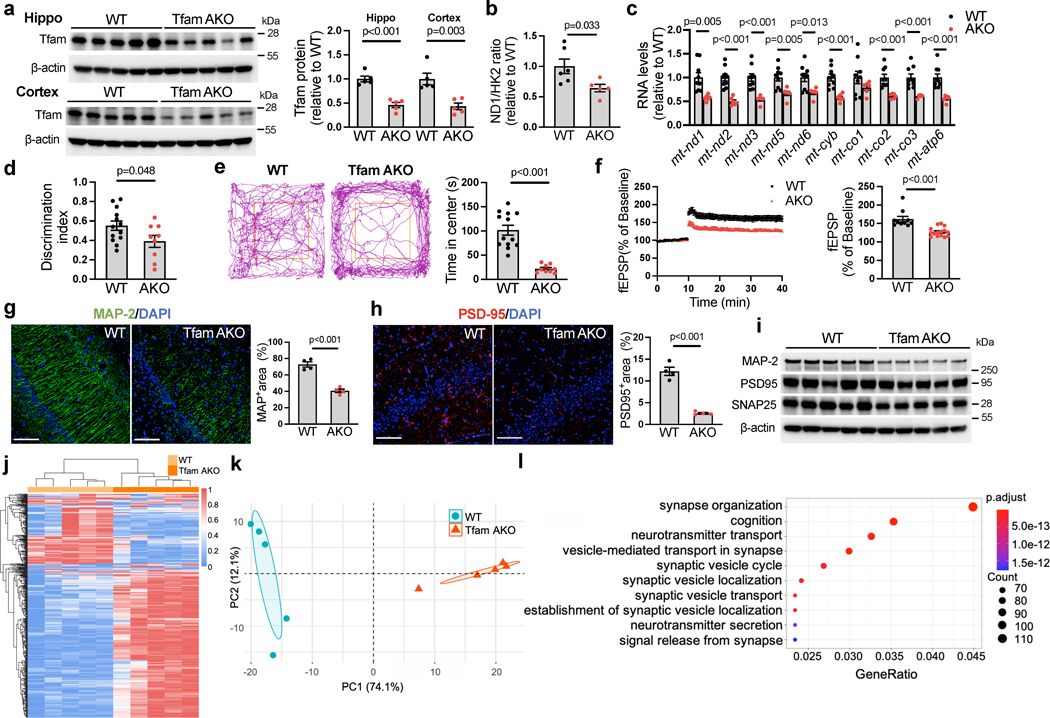
Fig. 1. Astrocyte-specific Tfam deletion induces cognitive impairment and neurodegeneration.
(a) Protein levels of Tfam in the hippocampus and cortex of 6-month-old WT and TfamAKO mice. (b) mtDNA copy numbers in the hippocampus of 6-month-old mice. (c) Levels of mtDNA-encoded transcripts of complexes I, III, IV and V in the cortex of 6-month-old mice. (d) Discrimination index of 6-month-old mice by the novel object recognition (NOR) test. (e) Representative 5-minute tracks and the time spent in the center area (marked by the orange squares) from the open field test of 6-month-old mice. (f) Recorded fEPSP slopes of hippocampal slices from 6-month-old mice normalized to the pre-tetanus baseline (left) and LTP quantified using %fEPSP for the last 5 min of the response to TBS stimulation (right). n = 10–15 slices from 4 mice per group. (g and h) Representative images and quantifications (positive area %) of 6-month-old mouse hippocampus sections stained for MAP-2 (g) and PSD95 (h). (i) Western blots showing protein expression of MAP-2, PSD95, and SNAP25 in 6-month-old mouse hippocampi (quantified in Extended Data Fig. 2a). (j and k) Heatmap (j) and PCA plot (k) showing the expression of top 500 variant genes in the hippocampus of 6-month WT and TfamAKO mice. (l) Top 10 GO Biological Processes enriched in 6-month WT hippocampus compared to that of TfamAKO mice. n = 5 (a, k) or 4 (g and h) mice; n = 6 (WT) or 5 (AKO) mice (b); n = 9 (WT) or 6 (AKO) mice (c); n = 13 (WT) or 9 (AKO) mice (d, e); n = 10 (WT) or 15 (AKO) slices from 4 mice (f). Bar graphs are presented as mean ± SEM. Two-sided unpaired t-test was used for all comparisons. Scale bars, 100 μm (g and h).

