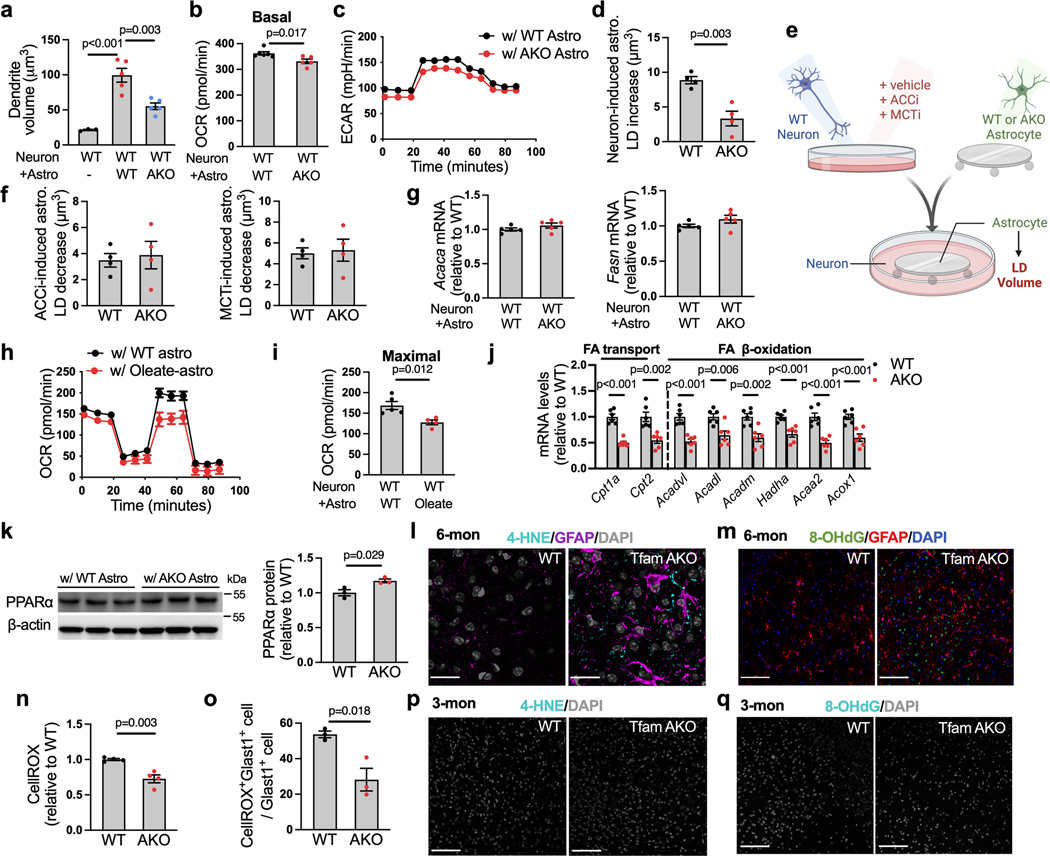
Extended Data Fig. 6. Loss of OxPhos diminishes astrocytic support to neurons and induces neuronal oxidative stress.
(a) Neurite volume of WT neurons cultured alone or with 6-month astrocytes. (b) Basal OCR of WT neurons cultured with 6-month astrocytes. (c) ECAR of WT neurons cocultured with 6-month astrocytes. (d) Increases in LD volume for WT or TfamAKO astrocytes cocultured with WT neurons relative to these astrocytes cultured alone. (e) Design for data in (f). WT neurons pretreated with vehicle, MCTi (AR-C155858) or ACCi (ND630) were cultured with WT or TfamAKO astrocytes. Astrocytes were stained for LD (image created with BioRender.com). (f) Reductions in LD volume in WT or TfamAKO astrocytes induced by neuronal MCTi (left) or neuronal ACCi (right). Presented values were calculated as: LD volume in astrocytes cocultured with vehicle-pretreated neurons – LD volume in genotype-matched astrocytes cocultured with ACCi- or MCTi-pretreated neurons. (g) mRNA levels of Acaca and Fasn in WT neurons cocultured with 6-month astrocytes. (h and i) OCR of WT neurons cocultured with 6-month oleate-BSA-treated WT astrocytes. (j) mRNA levels of genes involved in FA transport and β-oxidation in acute 6-month astrocytes. (k) Protein levels of PPARα in WT neurons cultured with 6-month astrocytes. (l and m) Representative images of hippocampal sections of 6-month mice co-stained for 4-HNE and GFAP or 8-OHdG and GFAP. (n) Relative CellROX intensity in cultured 6-month astrocytes. (o) CellROX positive rate of Glast1+ astrocytes in 6-month brains by flow cytometry analysis. (p and q) Representative images of hippocampal sections of 3-month mice stained for 4-HNE (p) or 8-OHdG (q). n = 3 (no-astrocyte) or 5 (+WT and +AKO) independent samples (a); n = 6 (WT) or 5 (AKO) independent samples (b, c); n = 4 (d, f), 5 (g), 6 (j), 3 (k, o), or 4 (n) independent samples; n = 5 (+WT) or 4 (+Oleate) independent samples (h, i). Bars are presented as mean ± SEM. Two-sided unpaired t-test was used except for a, where one-way ANOVA with post-hoc Tukey test was used. Scale bars, 100 μm (m, p, q); 25 μm (l).

