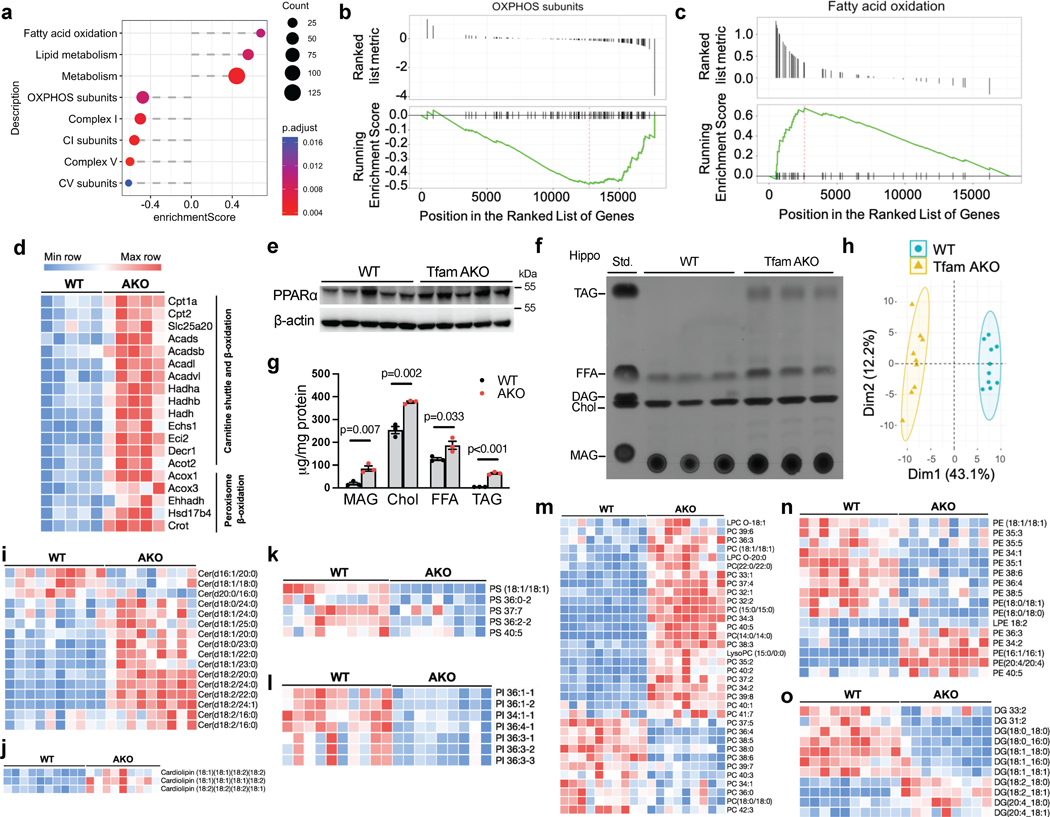
Fig. 2. Aberrant astrocytic OxPhos disrupts brain lipid homeostasis.
(a) GSEA identified significantly enriched (enrichment score > 0) or underrepresented (enrichment score < 0) mitochondrial pathways in 6-month TfamAKO mouse hippocampi relative to WT. (b and c) GSEA plots showing enrichment profiles of OXPHOS genes (b) and FAO genes (c). (d) Heatmap showing DEGs (FDR-corrected p < 0.05) related to mitochondrial and peroxisomal β-oxidation in 6-month mouse hippocampi. (e) Western blots showing increased levels of PPARα in 6-month TfamAKO hippocampi (quantified in Extended Data Fig. 3g). (f and g) TLC assay showing altered levels of major lipid classes in 6-month mouse hippocampi (f), which are quantified by normalizing to protein concentrations (g). Std., standard mix. (h) PCA plot of hippocampal lipidomic profile of 6-month WT and TfamAKO mice. (i-o) Heatmaps of the levels of different classes of lipid species that are significantly changed in 6-month TfamAKO vs. WT cortices, including ceramide (i), cardiolipin (j), PS (k), PI (l), PC (m), PE (n), and DAG (o). n = 3 mice (g); n = 10 (WT) or 9 (AKO) mice (h). Bar graphs are presented as mean ± SEM. Two-sided unpaired t-test was used for all comparisons.

