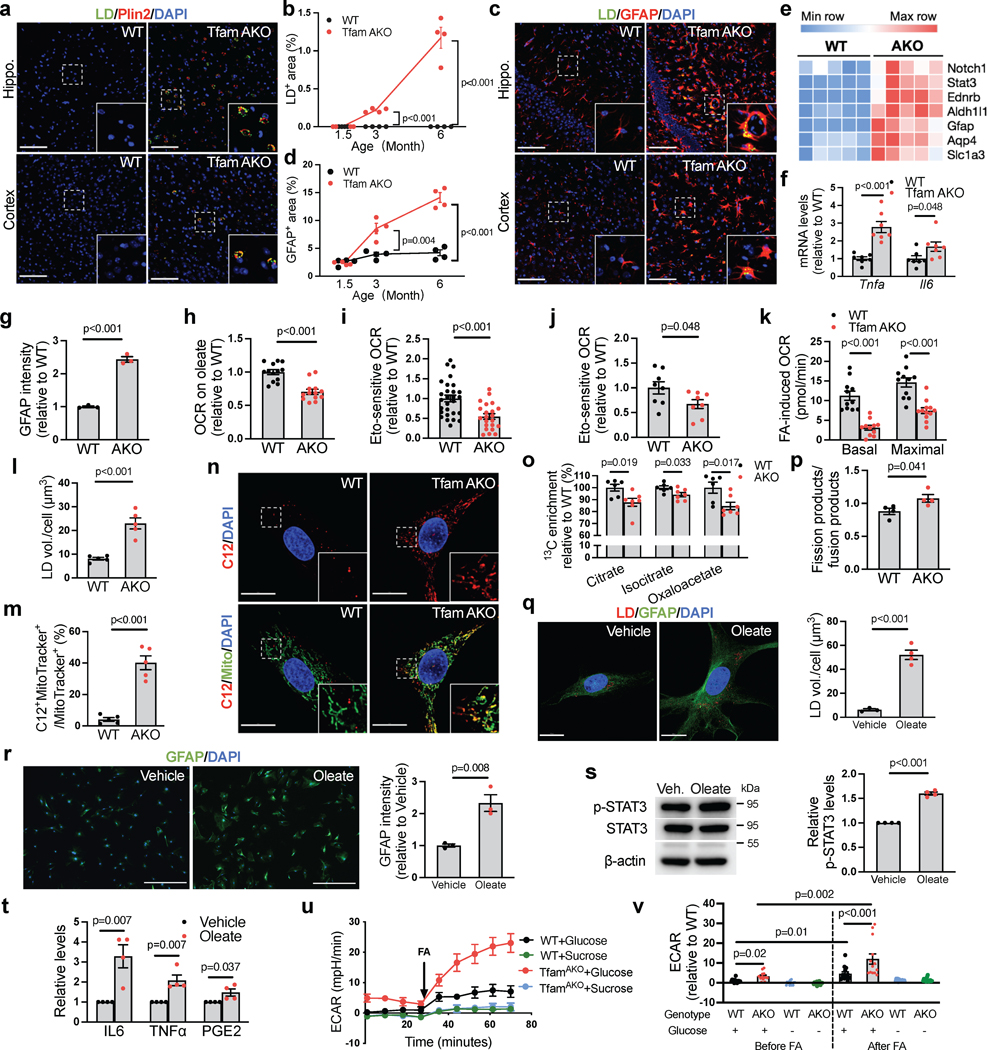
Fig. 3. Loss of astrocytic FA degradation leads to LD accumulation and reactive astrogliosis.
(a) Representative images of 6-month hippocampal or cortical staining for Plin2 and LD. (b) Quantification of LD+ area in hippocampal sections. (c) Representative images of hippocampal and cortical sections of 6-month mice. (d) Quantification of GFAP+ area in hippocampal sections. (e) Heatmap of reactive astrocyte DEGs in 6-month hippocampi. (f) Tnfa and Il6 mRNA levels in acute 6-month astrocytes. (g) GFAP intensity of cultured 6-month astrocytes. (h) Relative OCR of 6-month acute hippocampal slices on oleate-BSA. (i) Etomoxir-induced OCR decreases of 6-month acute hippocampal slices. (j) Etomoxir-induced OCR decreases of cultured 6-month astrocytes. (k) FA-induced basal and maximal OCRs in 6-month astrocytes presented as differences in the presence and absence of exogenous FA. (l) LD volume in cultured 6-month astrocytes. (m and n) Quantification and representative images of BODIPY-C12 localized to mitochondria in 6-month astrocytes. (o) 13C enrichment of TCA metabolites in astrocytes incubated with U-13C-oleate. (p) Ratio of mitochondrial fission to fusion products in 6-month astrocytes. (q) Representative images and quantification of LDs in 6-month WT astrocytes treated with oleate-BSA. (r) Representative images and quantification of GFAP intensity of WT astrocytes after oleate-BSA treatment. (s) Levels of p-STAT3Tyr705 in oleate-BSA-treated WT astrocytes. (t) Medium IL-6, TNFα, and PGE2 levels of oleate-BSA-treated WT astrocytes. (u and v) Representative ECAR curves and quantification of acute hippocampal slices before and after FA addition under glycemic or aglycemic conditions. n = 4 (b, d, p, s, t), 7 (f), 3 (g, r), 5 (l, m), 6 (o-WT), 7 (o-AKO), 3 (q-WT), or 4 (q-AKO) mice; n = 13 (h), 28 (i-WT), 22 (i-AKO) slices; n = 8 (j) or 11 (k) independent samples; n = 14 (WT-glucose), 13 (AKO-glucose), 14 (WT-sucrose), 15 (AKO-sucrose) slices (u,v). Bars and plots are presented as mean ± SEM. Two-sided unpaired t-test was used for all comparisons except for the comparisons before and after FA injections in v, where two-sided paired t-test was used. Scale bars, 500 μm (r); 100 μm (a and c); 25 μm (q); 20 μm (n).

