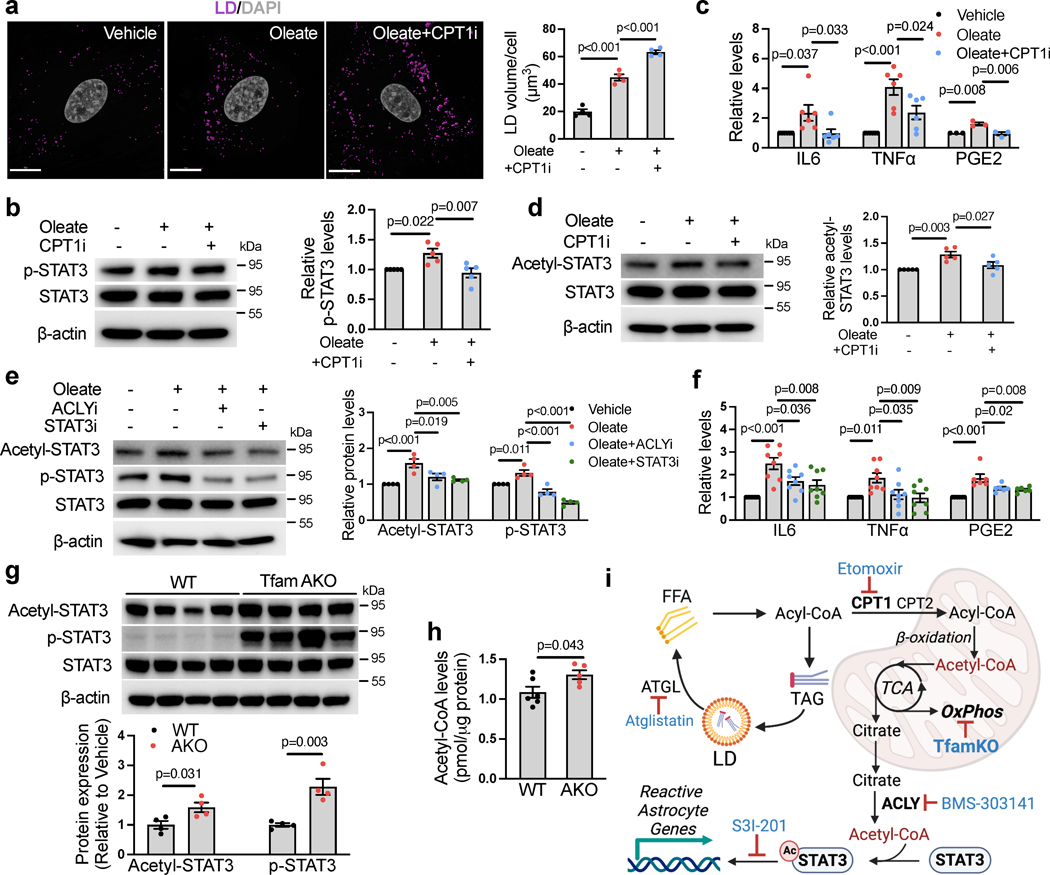
Fig. 4. Acetylation of STAT3 mediates FA- and TfamKO-induced astrocyte reactivity.
(a) Representative images and qualification of LD volumes in WT astrocytes treated with BSA (vehicle) or 150 μM oleate-BSA for 24 h with or without pretreatment of 10 μM etomoxir (CPT1i). (b) Representative western blots and quantification of p-STAT3Tyr705 in BSA- or oleate-BSA-treated astrocytes with or without CPT1i pretreatment. (c) IL-6, TNFα, and PGE2 levels in culture medium of BSA- or oleate-BSA-treated astrocytes with or without CPT1i pretreatment. (d) Representative western blots and quantification of acetyl-STAT3Lys685 in BSA- or oleate-BSA-treated astrocytes with or without CPT1i pretreatment. (e) Representative western blots and quantification of acetyl-STAT3Lys685 and p-STAT3Tyr705 in astrocytes treated with BSA or 150 μM oleate-BSA for 24 h with or without pretreatment of 50 μM BMS-303141(ACLYi) or 50 μM S3I-201 (STAT3i). (f) IL-6, TNFα, and PGE2 levels in culture medium of BSA- or oleate-BSA-treated astrocytes with or without ACLYi or STAT3i pretreatment. (g) Western blots and quantifications of acetyl-STAT3Lys685 and p-STAT3Tyr705 levels in the hippocampus of 6-month WT and TfamAKO mice. (h) Acetyl-CoA levels in the cortex of 6-month WT and TfamAKO mice. (i) Schematic representation of the mechanism by which Tfam deletion or exogenous FA induce astrocyte reactivity; key components and inhibitors involved are shown (image created with BioRender.com). n = 4 (a, e, g) or 5 (b and d) mice; n = 6 (IL6 and TNFα) or 3 (PGE2) mice (c); n = 8 (IL6 and TNFα) or 6 (PGE2) mice (f); n = 6 (WT) or 5 (AKO) mice (h). Bar graphs are presented as mean ± SEM. Two-sided unpaired t-test (g and h) and one-way ANOVA with post-hoc Tukey test (a-f) was used. Scale bar, 15 μm (a).

