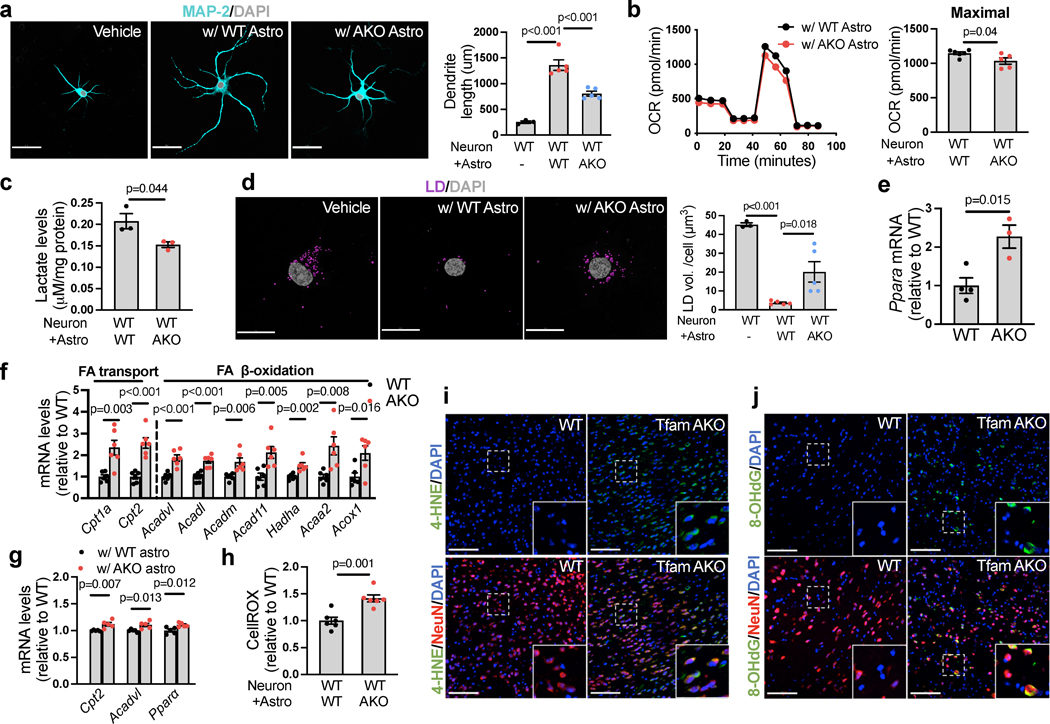
Fig. 5. Impaired astrocytic FA degradation diminishes neurotrophic support and triggers neuronal FAO and oxidative stress.
(a) Representative images of WT hippocampal neurons cultured alone (on coverslips in 6-well plates) or cocultured with WT or TfamAKO astrocytes (in 6-well inserts) for 7 days and immunostained for MAP-2 with neurite length quantified. (b) Mito Stress Test of WT neurons (in 24-well Seahorse plate) cultured with WT or TfamAKO astrocytes (in 24-well insert) for 7 days with quantifications of maximal respiration (after FCCP injection) shown. (c) Lactate levels in WT neurons (in 6-well plates) cultured with WT or TfamAKO astrocytes (in 6-well inserts) for 7 days. (d) Representative images and qualification of LD volumes in WT neurons cultured alone or with WT or TfamAKO astrocytes for 7 days. (e) mRNA levels of Ppara in neurons acutely isolated from 6-month mouse brains. (f) mRNA levels of genes involved in FA transport and FAO in neurons acutely isolated from 6-month mouse brains. (g) mRNA levels of Cpt2, Acadvl, and Ppara in WT neurons cultured with WT or TfamAKO astrocytes for 7 days. (h) Relative ROS levels (CellROX intensity) in WT neurons (in 6-well plates) cultured with WT or TfamAKO astrocytes (in 6-well inserts) for 7 days. (i and j) Representative images of hippocampal sections of 6-month WT and TfamAKO mice stained for NeuN and 4-HNE (i) or NeuN and 8-oxo-2’-deoxyguanosine (8-OHdG) (j). n = 3 (no-astrocyte) or 5 (+WT and +AKO) independent samples (a,d); n = 6 (WT) or 5 (AKO) independent samples (b); n =3 (c), 5 (g), or 6 (h) independent samples; n = 4 (WT) or 3 (AKO) mice (e); n = 6 mice (f). Bar graphs are presented as mean ± SEM. Two-sided unpaired Student’s t-test (b,c,e-h) or one-way ANOVA with post-hoc Tukey test (a,d) was used. Scale bars, 100 μm (i, j); 50 μm (a); 20 μm (d).

